Disclaimer
Information provided on this website is general in nature and does not constitute financial advice. Every effort has been made to ensure that the information provided is accurate. Individuals must not rely on this information to make a financial or investment decision. Before making any decision, we recommend you consult a financial adviser to take into account your particular investment objectives, financial situation and individual needs.
Weekly Market Update – 7th July 2023

Investment markets and key developments
- Global share markets fell sharply over the last week on concerns that stronger than expected US economic data will result in higher for longer interest rates not helped by somewhat hawkish US Fed meeting minutes. Despite a weaker than feared rise in US payrolls US shares still fell further on Friday as wages growth was stronger than expected leaving the US share market down 1.2% for the week. For the week Eurozone shares fell 3.2%, Japanese shares fell 2.4% and Chinese shares lost 0.4%. The weak global lead saw the Australian share market fall 2.2%, despite the RBA’s decision to leave interest rates on hold. Bond yields rose sharply on the back of higher for longer interest rate expectations with the Australian 10-year bond yield breaking up to its highest since 2014. Oil prices rose on the back of Saudi Arabia saying it will extend its production cuts into August and Russia saying it will cut its oil exports. Metal prices rose but iron ore prices rose fell. The $A rose as the $US fell.
- After a strong run in June and over the last financial year, shares remain vulnerable to a pull back. The global share market surge in June contained some positive signs for the direction setting US share market: gains have broadened out from tech to include more cyclical sectors; years that have seen a 10% plus gain in US shares the first half of the year have gone on to deliver strong returns for the year as a whole in 19 out of 23 times since 1945; the strength in US shares so far this year is consistent with the strength normally seen in US shares after mid-term election years; and the US share market since its low in October last year is continuing to trace out a pattern of rising highs and rising lows. From a fundamental perspective, continue to see global and Australian shares doing okay on a 12-month view as central banks ease up as inflation cools.
- However, the risk of a near term correction in global and Australian shares remains high as: the strong US share market rebound in June left US shares a bit overbought and vulnerable; while lagging economic indicators (like jobs data) are still strong, leading indicators continue to point to a high risk of recession; major central banks, including the RBA, remain hawkish and continuing strength in jobs data as seen in the US in the last week increases the risk that they will over tighten; reflecting this, bond yields appear to be breaking higher which could pressure share market valuations anew; China’s recovery continues to disappoint; and the period out to September/October is often rough for shares.
- The RBA opted to leave rates on hold in July at 4.1%, but the pause looks temporary. While contrary to the assessment that it would hike rates again its decision to hold was sensible given the degree of tightening we have already seen and the lagged impact of this on the economy. However, the RBA’s accompanying commentary was similar to what it said in April after a pause before hiking again in May: pausing provides time to better assess the outlook but “some further tightening of monetary policy may be required”. In particular, the RBA appears to be waiting for the June quarter CPI at the end of this month and its next round of forecast revisions in early August (which are likely to revise up its wages forecasts) and Governor Lowe may mention this in a speech this Wednesday. So given the RBA’s ongoing concern about inflation being too high, sticky services inflation, the tight labour market and rising wages growth, barring a sharp downside surprise in coming jobs and inflation data, allow another 0.25% hike in August and a final 0.25% in September taking the cash rate to a peak of 4.6%.
- However, views remain that the RBA has already done more than enough to slow the economy and bring inflation to target. Monetary policy impacts the economy with a lag of up to one year. The lagged impact on the household sector this time around has likely been lengthened thanks to savings buffers built up in the pandemic, the reopening boost and more than normal home borrowers locking in at 2% or so fixed rates. However, these protections are now wearing off particularly with many fixed rate mortgages now resetting. And we are now seeing increasing evidence that rate hikes are biting with falling real retail sales, a sharp fall in building approvals, slowing business investment, slowing GDP growth, more negative corporate commentary, rising insolvencies and falling job openings. As a result of ongoing rate hikes, the risk of recession in the next year is very high at about 50% with consumer spending almost certain to start going backwards later this year as the 4% plus cash rate will push debt interest payments to around record levels as a share of household income (as fixed rate borrowers roll off to variable rates and past variable rate hikes flow through). See the next chart. Reflective of the risks on this front a survey by AMP Bank found that nearly 70% of homeowners with a mortgage are worried about meeting their payments if rates continue to rise, with 31% worried right now. In a positive sign at least that the RBA sees rates as getting closer to the top it acknowledged that higher rates “are working to establish a more sustainable balance between supply and demand.”

Source: ABS, AMP
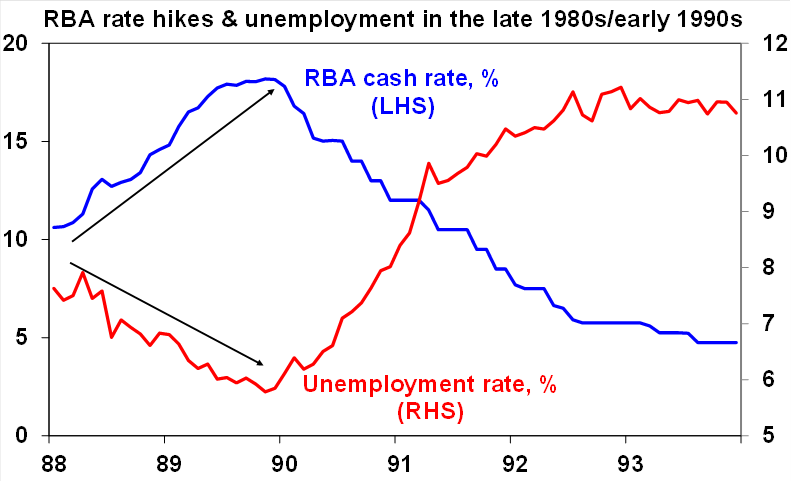
- Echoes of 1988-89. The current RBA rate hiking cycle is the biggest since the late 1980s. Back then the cash rate rose dramatically from 10.6% to combat high inflation but unemployment kept falling reflecting prior stimulus leading many to conclude the economy was impervious, so the RBA kept going with the cash rate ultimately reaching 18.2% by the end of 1989. But then the lagged impact of all the rate hikes hit and the economy slumped into “the recession we had to have”. Of course, lots of things were different back then with household debt ratios being about one third of current levels, much higher inflation expectations and the RBA not getting the benefit of an announcement effect of rate hikes because it didn’t announce them. But the key message of relevance to today is to beware the way rate hikes impact with a lag and that the economy can be “okay until it’s not!”
Source: ABS, AMP
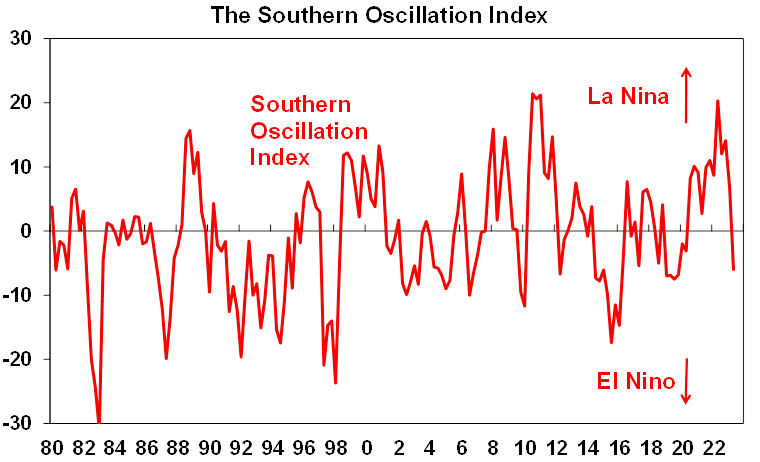
- From La Nina to El Nino. Consistent with, and helping drive, various forecasts globally that we have entered another El Nino (drier for Australia) weather phenomenon after several years in La Nina (which is wetter for Australia), the Australian Bureau of Meteorology’s Southern Oscillation Index pushed down into El Nino territory over the last quarter. This was particularly so in May – the chart below shows a quarterly average – but it fortunately bounced back to neutral in June. So, its worth keeping an eye on. An El Nino would potentially push up food prices – although its not clear cut with La Nina related east coast flooding pushing up some Australian food prices anyway in the last two years.
Source: Australian Bureau of Meteorology, AMP
Economic activity trackers
- The Economic Activity Trackers ticked down over the last week in Australia, the US and Europe. They are yet to indicate a decisive fall in economic activity though.
![]()
Levels are not really comparable across countries. Based on weekly data for eg job ads, restaurant bookings, confidence, credit & debit card transactions and hotel bookings. Source: AMP
Major global economic events and implications
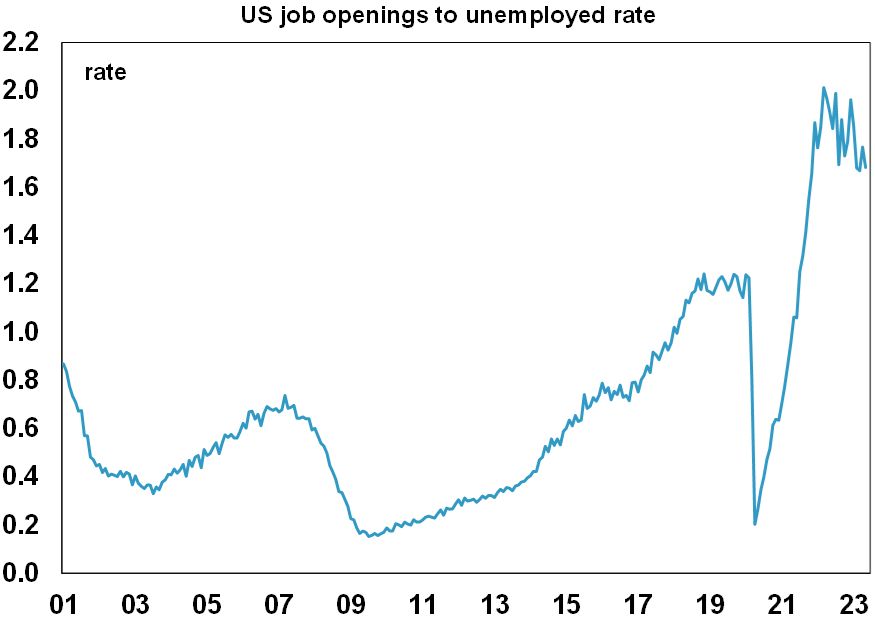
- US data releases over the last week were mixed. The ISM manufacturing conditions index fell to 46, its lowest level in more than three years with employment down, but the services ISM surprisingly rose to a solid 53.9 with employment up. Similarly, jobs data was mixed with the ADP private sector jobs survey surging in June, the Challenger survey showing falling layoffs and quits data showing a rise but initial jobless claims rising and job openings falling. The ratio of job openings to unemployed is continuing to trend down indicating a softening jobs market but it remains high. Payroll job growth in June came in softer than expected (and way below that indicated by the ADP report highlighting its unreliable track record) and with downward revisions it’s still strong but shows an ongoing slowing trend. Unemployment dipped to 3.6% but still appears to be bottoming and underemployment rose. Meanwhile, wages growth came in slightly stronger than expected at 4.4%yoy. The overall impression is that the US jobs market is cooling but remains tight with wages growth still too high for the Fed. This likely keeps the Fed on track for a July hike but September is unclear. On the inflation front though, prices paid in both the ISM surveys fell and are well down from their 2021-22 highs.
Source: Macrobond, AMP
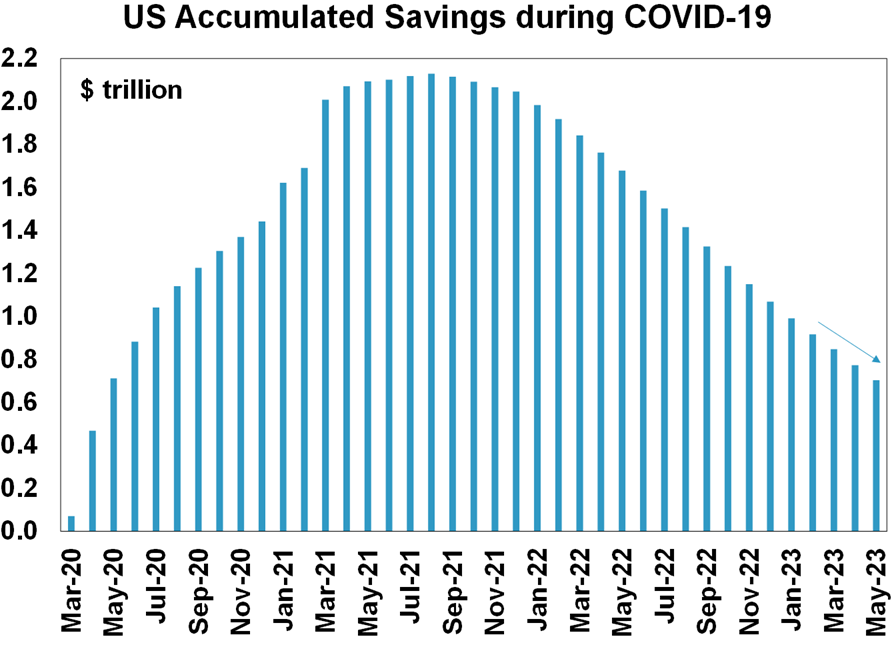
- Interestingly, the pool of US households’ excess savings built up through the pandemic/lockdown years has now been run down sharply on the estimates and on the Fed’s estimates it’s now been more than wiped out suggesting that this source of support for consumer spending has now faded.
Source: Macrobond, AMP
- Eurozone producer price inflation in May fell to -1.5%yoy from a high last year of over 40% pointing to a further fall in CPI inflation. Energy prices are down 13%yoy but consumer goods output price inflation has also fallen from around 5%yoy to around 3%yoy
- The Bank of Japan’s June quarter Tankan business survey showed generally improved business conditions and some easing in price pressures. Japanese wages growth accelerated again in May but only to 2.5%yoy. Comments to the media by BoJ Deputy Governor Uchida were dovish but left often the chance of a change to yield curve control soon.
- Chinese Caixin business conditions PMIs confirmed the message from the officials PMIs in showing slower but still solid services conditions but weak manufacturing conditions. However, its worth noting that both are in the same range they were in in 2012-2016.
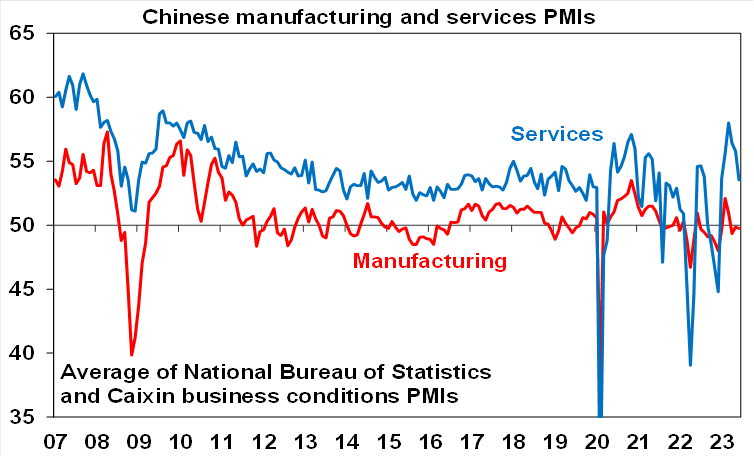
Source: Bloomberg, AMP
- By contrast though business conditions PMIs in India while down slightly in June remained very strong with the manufacturing PMI at 57.8 and the services PMI at 58.5.
- Just as major advanced countries are seeing falling inflation the same applies across Asia with Indonesia, South Korea, The Philippines, Thailand and Taiwan all reporting significant falls in inflation in the last week.
Australian economic events and implications
- Australian housing related indicators were strong over the last week with building approvals, housing finance and home prices all up. However, the huge 20.6% May bounce in building approvals was driven by a 59% surge in multi-unit approvals which are very volatile. Approvals to build new homes are still well down on their highs and point to period of weakness in home building once the pipeline of work yet to be done is completed. Given its rapid population growth Australia needs to be building around 225,000 new homes a year but the level of approvals currently only implies about 163,000 a year.
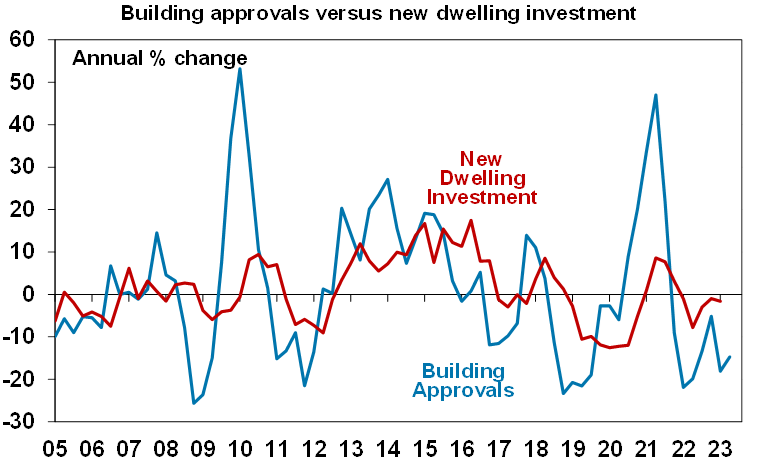
Source: ABS, AMP
- The 4.8% rise in housing finance commitments in May with a rising trend from their low in February is consistent with the rebound in home prices since February with the rise in commitments being for existing or already built homes not for new construction.
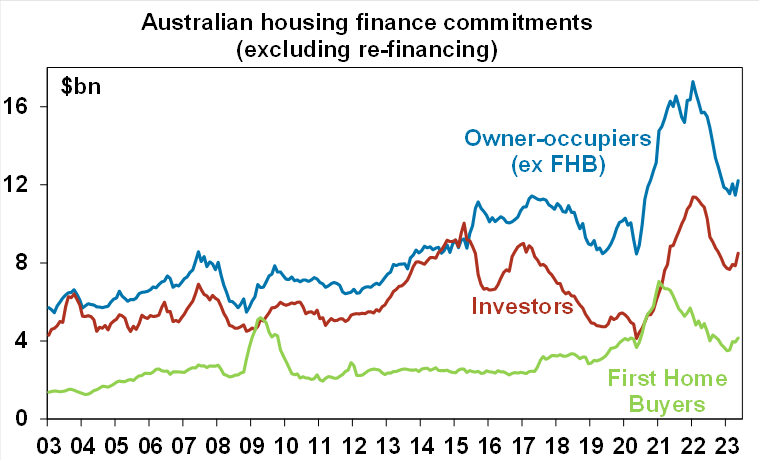
Source: ABS, AMP
- CoreLogic data confirmed a fourth month of rising national home prices in June, led by Sydney, with prices now up 3.4% from their February low. The underlying demand supply imbalance with a surging population and an element of FOMO have been dominating rising rates. But the risk of another leg down in prices as a result of the collapse in the capacity of new buyers to pay (due to higher rates) and a rise in unemployment over the year ahead is high. There are some signs of a slowing in price gains and auction clearance rates have weakened in recent weeks.
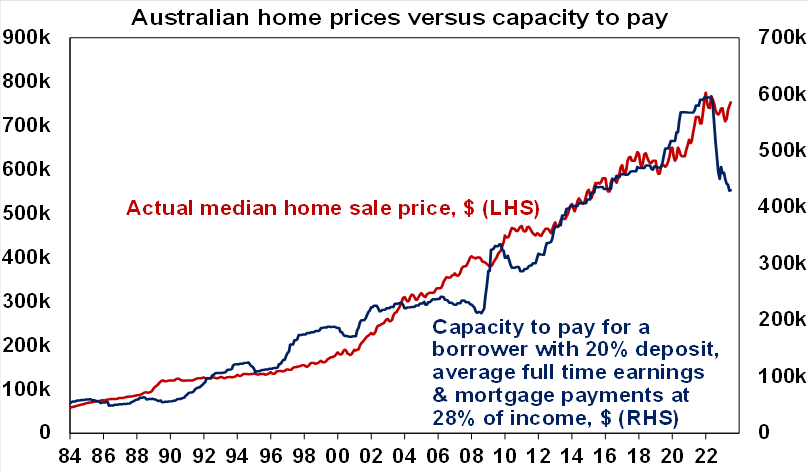
Source: RBA, CoreLogic, AMP
- Australia’s trade surplus rose slightly in May to $11.8bn with stronger exports. Exports to China are trending up but as a share of total goods exports are around 10% down from their high.
- The Melbourne Institute’s Inflation Gauge for June was up 5.7%yoy and looks to have peaked but inflation in its trimmed mean still appears to be edging up, albeit at a much lower level than reported in the ABS’ CPI.
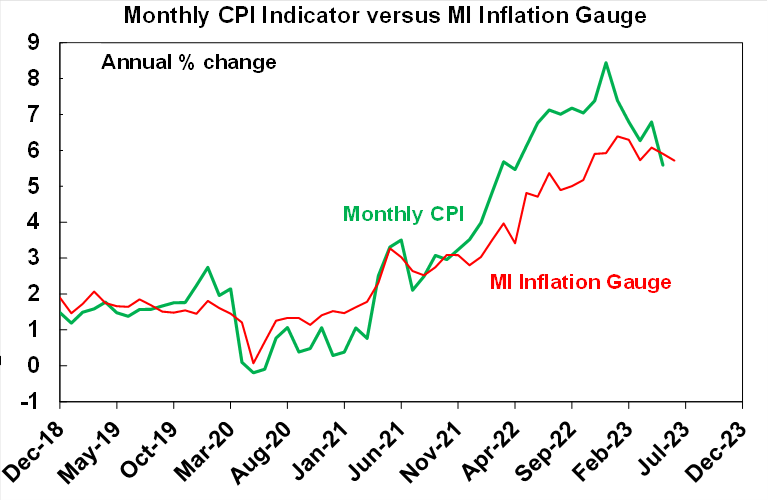
Source: Melbourne Institute, ABS, AMP
- Meanwhile on the wages front, newly approved wage rises under enterprise bargaining agreements in the March quarter rose to an annualised increase of 3.7%, their highest since 2012 but recently lodged agreements have seen some slowing – so the RBA should not be too fussed, at least for now.
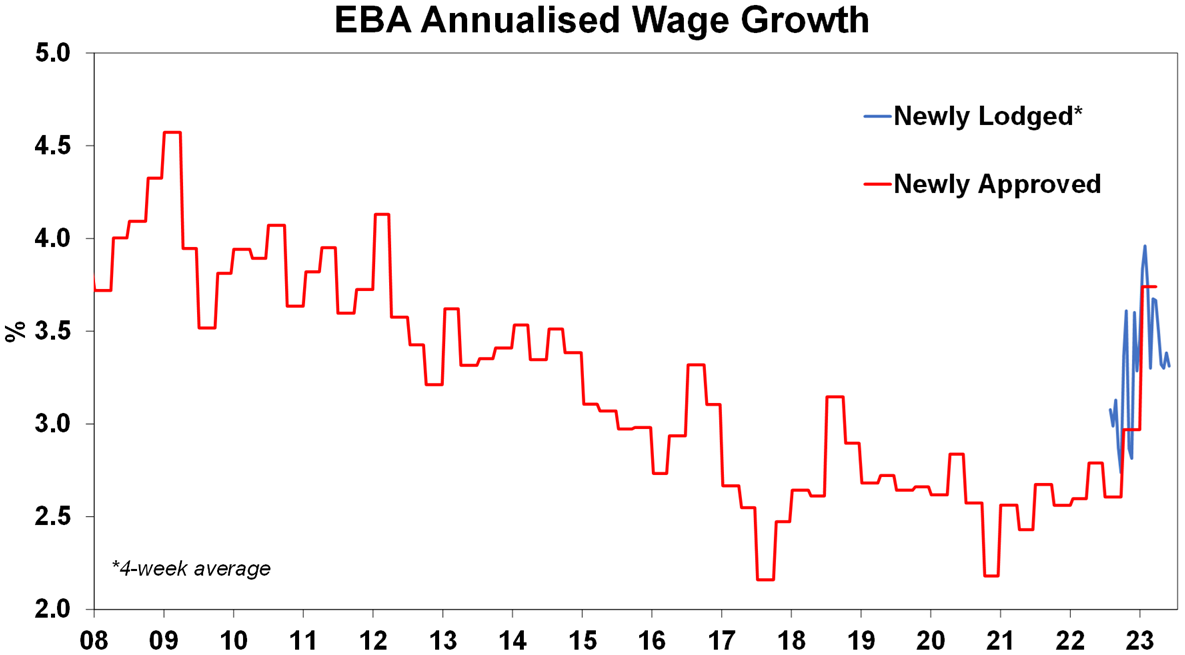
Source: Fair Work Commission, AMP
What to watch over the next week?
- In the US, the focus will be back on inflation with June CPI data (Tuesday) expected to show a collapse in inflation to 3.1%yoy, but with a core inflation remaining a bit stickier for now albeit falling to 5%yoy (from 5.3%). Producer price inflation (Thursday) is also expected to slow further to 0.4%yoy from 1.1%. June small business optimism data will also be released on Monday. US June quarter earnings results are also expected to start flowing.
- Chinese June CPI inflation (Monday) is likely to have remained at just 0.2%yoy with producer prices down 5%yoy. Trade data (Thursday) is expected to see further falls in exports and imports. Money supply and credit data for June will also be released.
The Reserve Bank of New Zealand (Wednesday) is expected to leave its policy rate on hold at 5.5%.
- In Australia, a speech by RBA Governor Lowe (Wednesday) on “The Reserve Bank Review and Monetary Policy” looks like it will discuss what impact if any the Review with have on monetary policy – probably not a lot in my view but if implemented it could make the RBA a bit more aggressive. The speech and any Q&A may also see the Governor indicate that the decision to pause should not be seen as signalling that interest rates have peaked, that waiting till August provides a better opportunity to assess things – given the June quarter CPI released later this month and updated RBA forecasts – and reiterate that more rate hikes may be needed. Westpac/MI consumer confidence data for July may show a bit of a rise from very depressed levels given the RBA’s decision to pause rate hikes but softer PMIs point to weaker NAB survey business conditions and confidence with both to be released on Tuesday.
Outlook for investment markets
- The next 12 months are likely to see a further easing in inflation pressures and central banks moving to get off the brakes. This should make for reasonable share market returns, provided any recession is mild. But the next few months are likely to be rough given high recession and earnings risks, still hawkish central banks and poor seasonality out to around September/October. This is likely to impact both global and Australian shares.
- Bonds are likely to provide returns above running yields, as growth and inflation slow and central banks become dovish.
- Unlisted commercial property and infrastructure are expected to see soft returns, reflecting the lagged impact of last year’s rise in bond yields on valuations. Commercial property returns are likely to be negative as “work from home” hits space demand as leases expire.
- With an increasing supply shortfall, the national average home price forecast for this calendar year has been revised up to around flat to up slightly ahead of 5% growth next year. However, the risk is high of a further leg down putting us back on track for a 15-20% top to bottom fall on the back of the impact of high and still rising interest rates and higher unemployment.
- Cash and bank deposits are expected to provide returns of around 4%, reflecting the back up in interest rates.
The $A is at risk of more downside in the short term, but a rising trend is likely over the next 12 months, reflecting a downtrend in the overvalued $US and the Fed moving to cut rates.
Source: AMP ‘Weekly Market Update’