Disclaimer
Information provided on this website is general in nature and does not constitute financial advice. Every effort has been made to ensure that the information provided is accurate. Individuals must not rely on this information to make a financial or investment decision. Before making any decision, we recommend you consult a financial adviser to take into account your particular investment objectives, financial situation and individual needs.
Weekly Market Update – 4th August 2023

Investment markets and key developments
- Global equities fell over the past week off the back of a rise in global bonds yields, a risk-off sentiment in markets partly related to the US credit rating downgrade and recent strong gains in shares which made them vulnerable to a pull-back. US S&P500 shares were down by 1.9% (but are up by a massive 17% since the beginning of the year), Australian shares fell by 1.3%, Eurozone shares declined by 3.6%, Japanese stocks declined by 1.6% and Chinese shares were virtually flat. Commodities were mixed with oil prices up above $80/barrel, metals prices mixed and agricultural prices down. The $US was up by and the $A fell slightly to 0.65USD.
- The 10-year bond yield rose to 4.17%, its highest level since November 2022 and just a touch below the post-Covid high of just over 4.2%. US yields were already rising last week (after the Bank of Japan’s announcement to allow some more flexibility in its yield target) and got another boost after the announcement of an unexpected increase in long term US bond issuance which puts upward pressure on yields and the downgrade to the US credit rating. Market pricing for interest rates has not risen over the past few weeks so the move up in yields is unlikely to persist as most central bank interest rates are around or close to a peak.
- Ratings agency Fitch downgraded the US from AAA to AA+ because of: an expected deterioration in the fiscal position in the next 3 years (i.e. no improvement in the budget deficit – see chart below), a high and increasing government debt load and an erosion of governance related to AA and AAA rated peers.
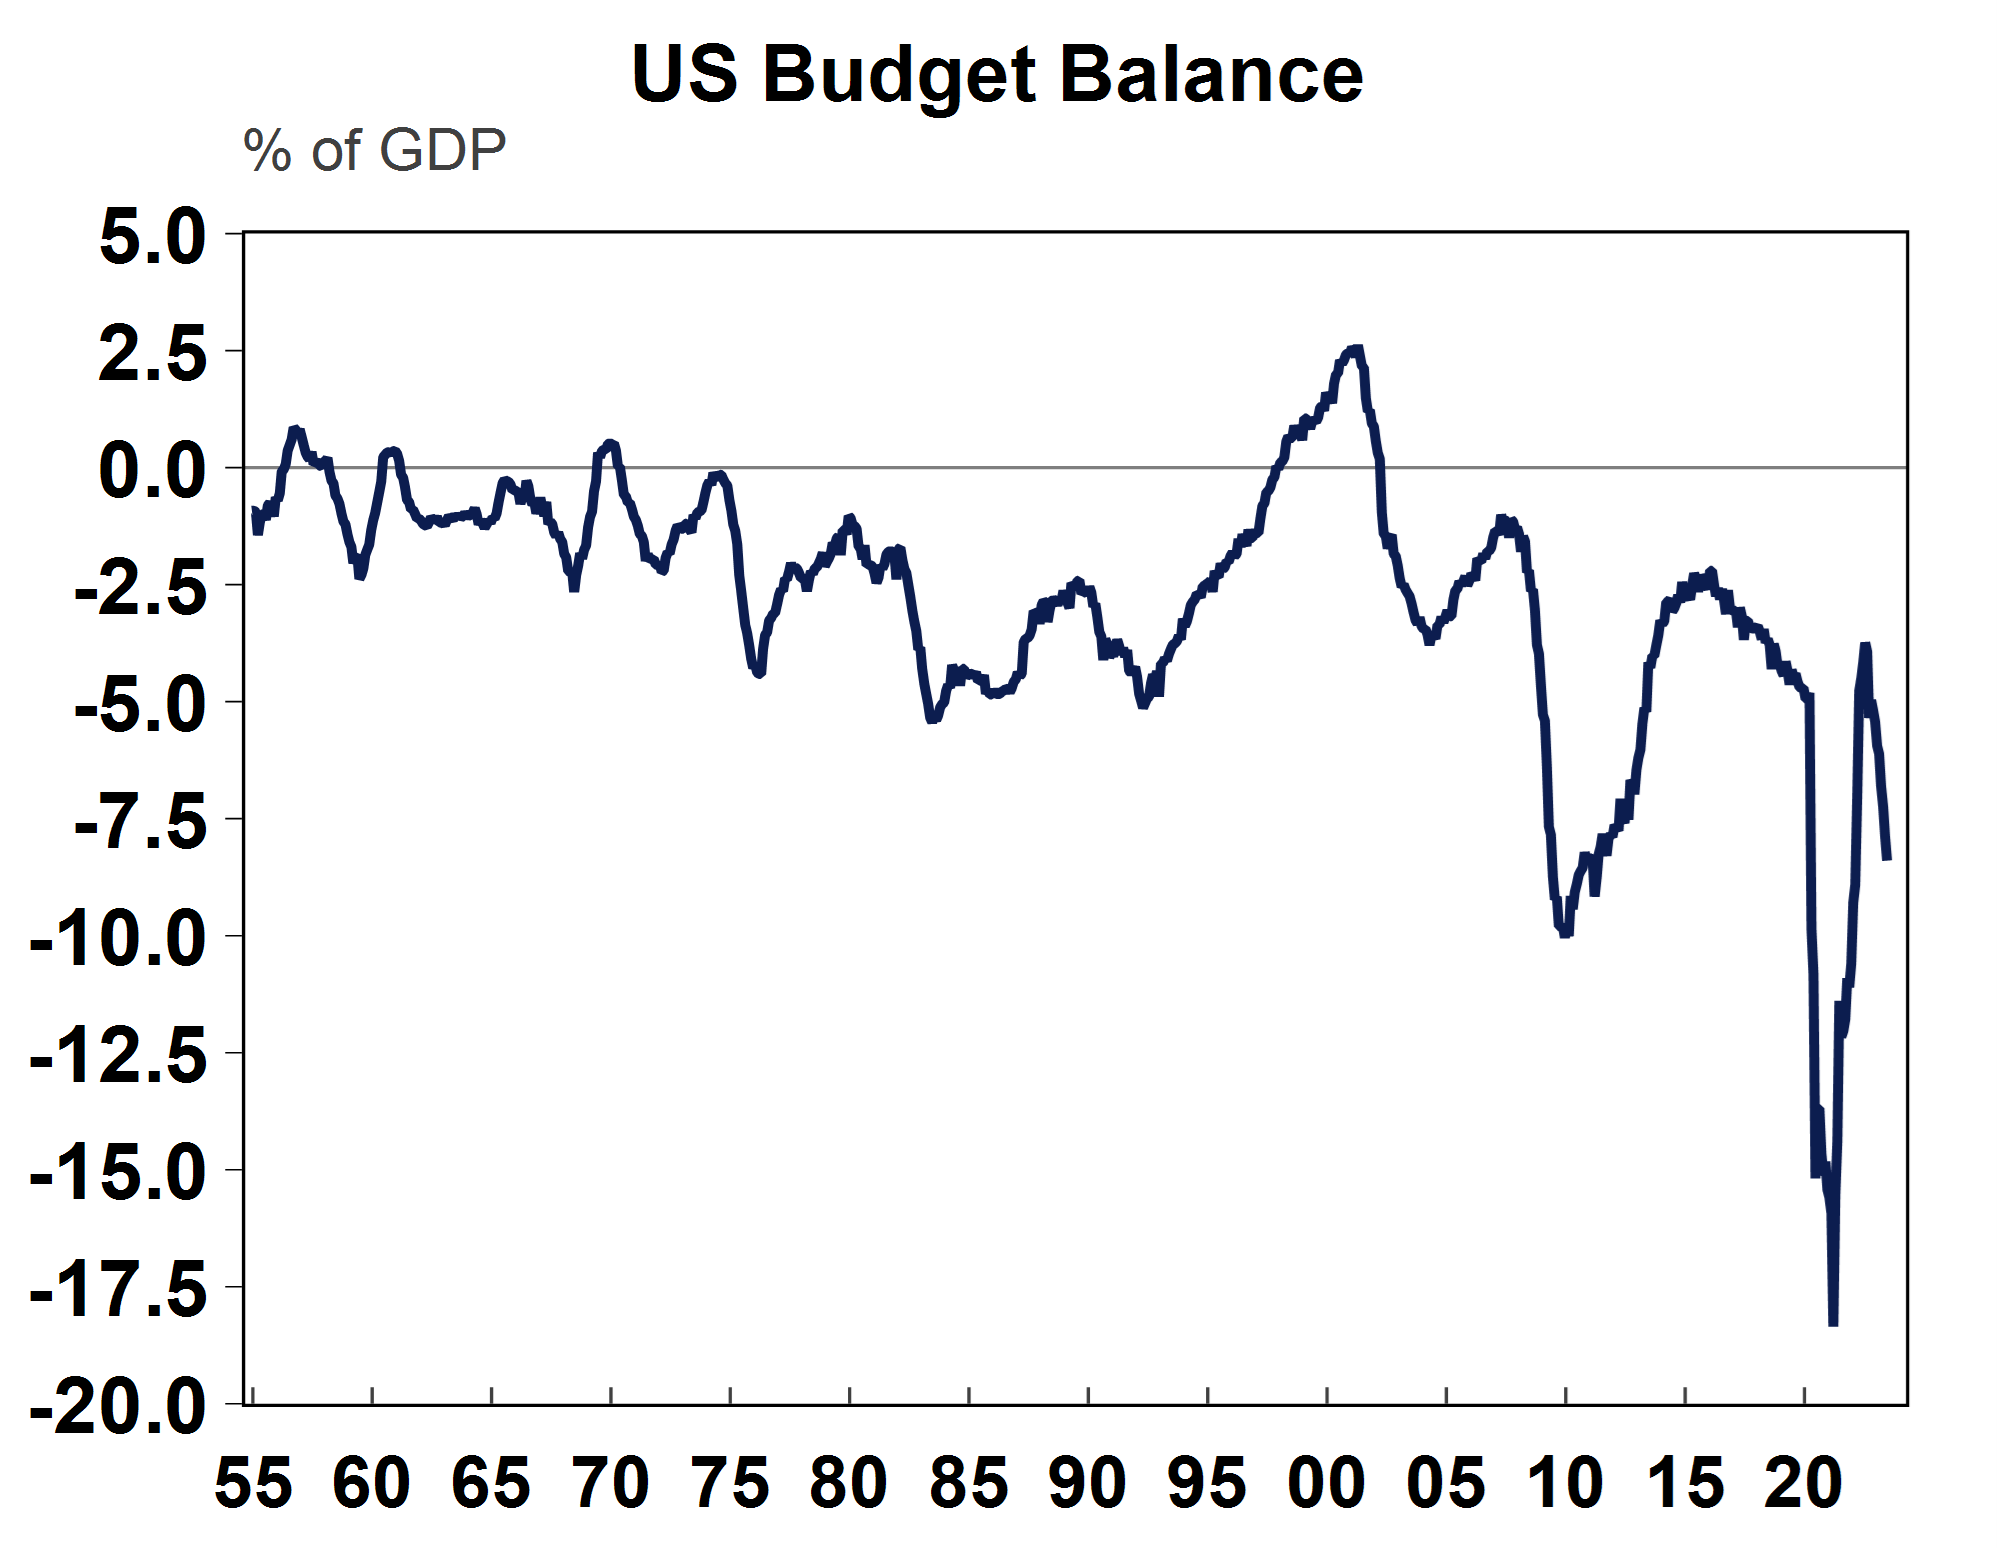
Source: Macrobond, AMP
- This outcome was not a surprise, as Fitch had already said in May that a ratings downgrade was a possibility due to the repeated debt limit standoffs and last-minute spending resolutions. Other ratings agencies like Moody’s give the US a Aaa credit rating (its highest rating) and S&P has it at AA+ (after downgrading it in 2011 after a prior debt ceiling crisis). A downgrade to a credit rating usually means a greater risk of default which results in higher bond yields. But, a US default is seen as an extremely low chance so yields are unlikely to increase significantly just from the credit rating downgrade. The prior downgrade to the credit rating in 2011 resulted in some downward pressure for shares but bond yields went down (rather than up) and there were no major long-term implications for markets. This time round, the credit rating downgrade could increase market nervousness’s at time when recession concerns are already high and result in a risk-off tone in markets, especially as equities are already at risk of a near-term pullback. From a political point of view, it also means that the upcoming budget negotiations could result in some reigning in of fiscal spending which will weigh on growth in 2024, ahead of the Presidential election which would not be good for Democrat odds of being re-elected.
Economic activity trackers
- The Economic Activity Indicators fell slightly in the US and Europe from an increase in weekly jobless claims and a decline in restaurant bookings. Australia’s tracker improved from a tick up in consumer confidence. The trackers are still holding up well overall and are not consistent with recessionary-like conditions.
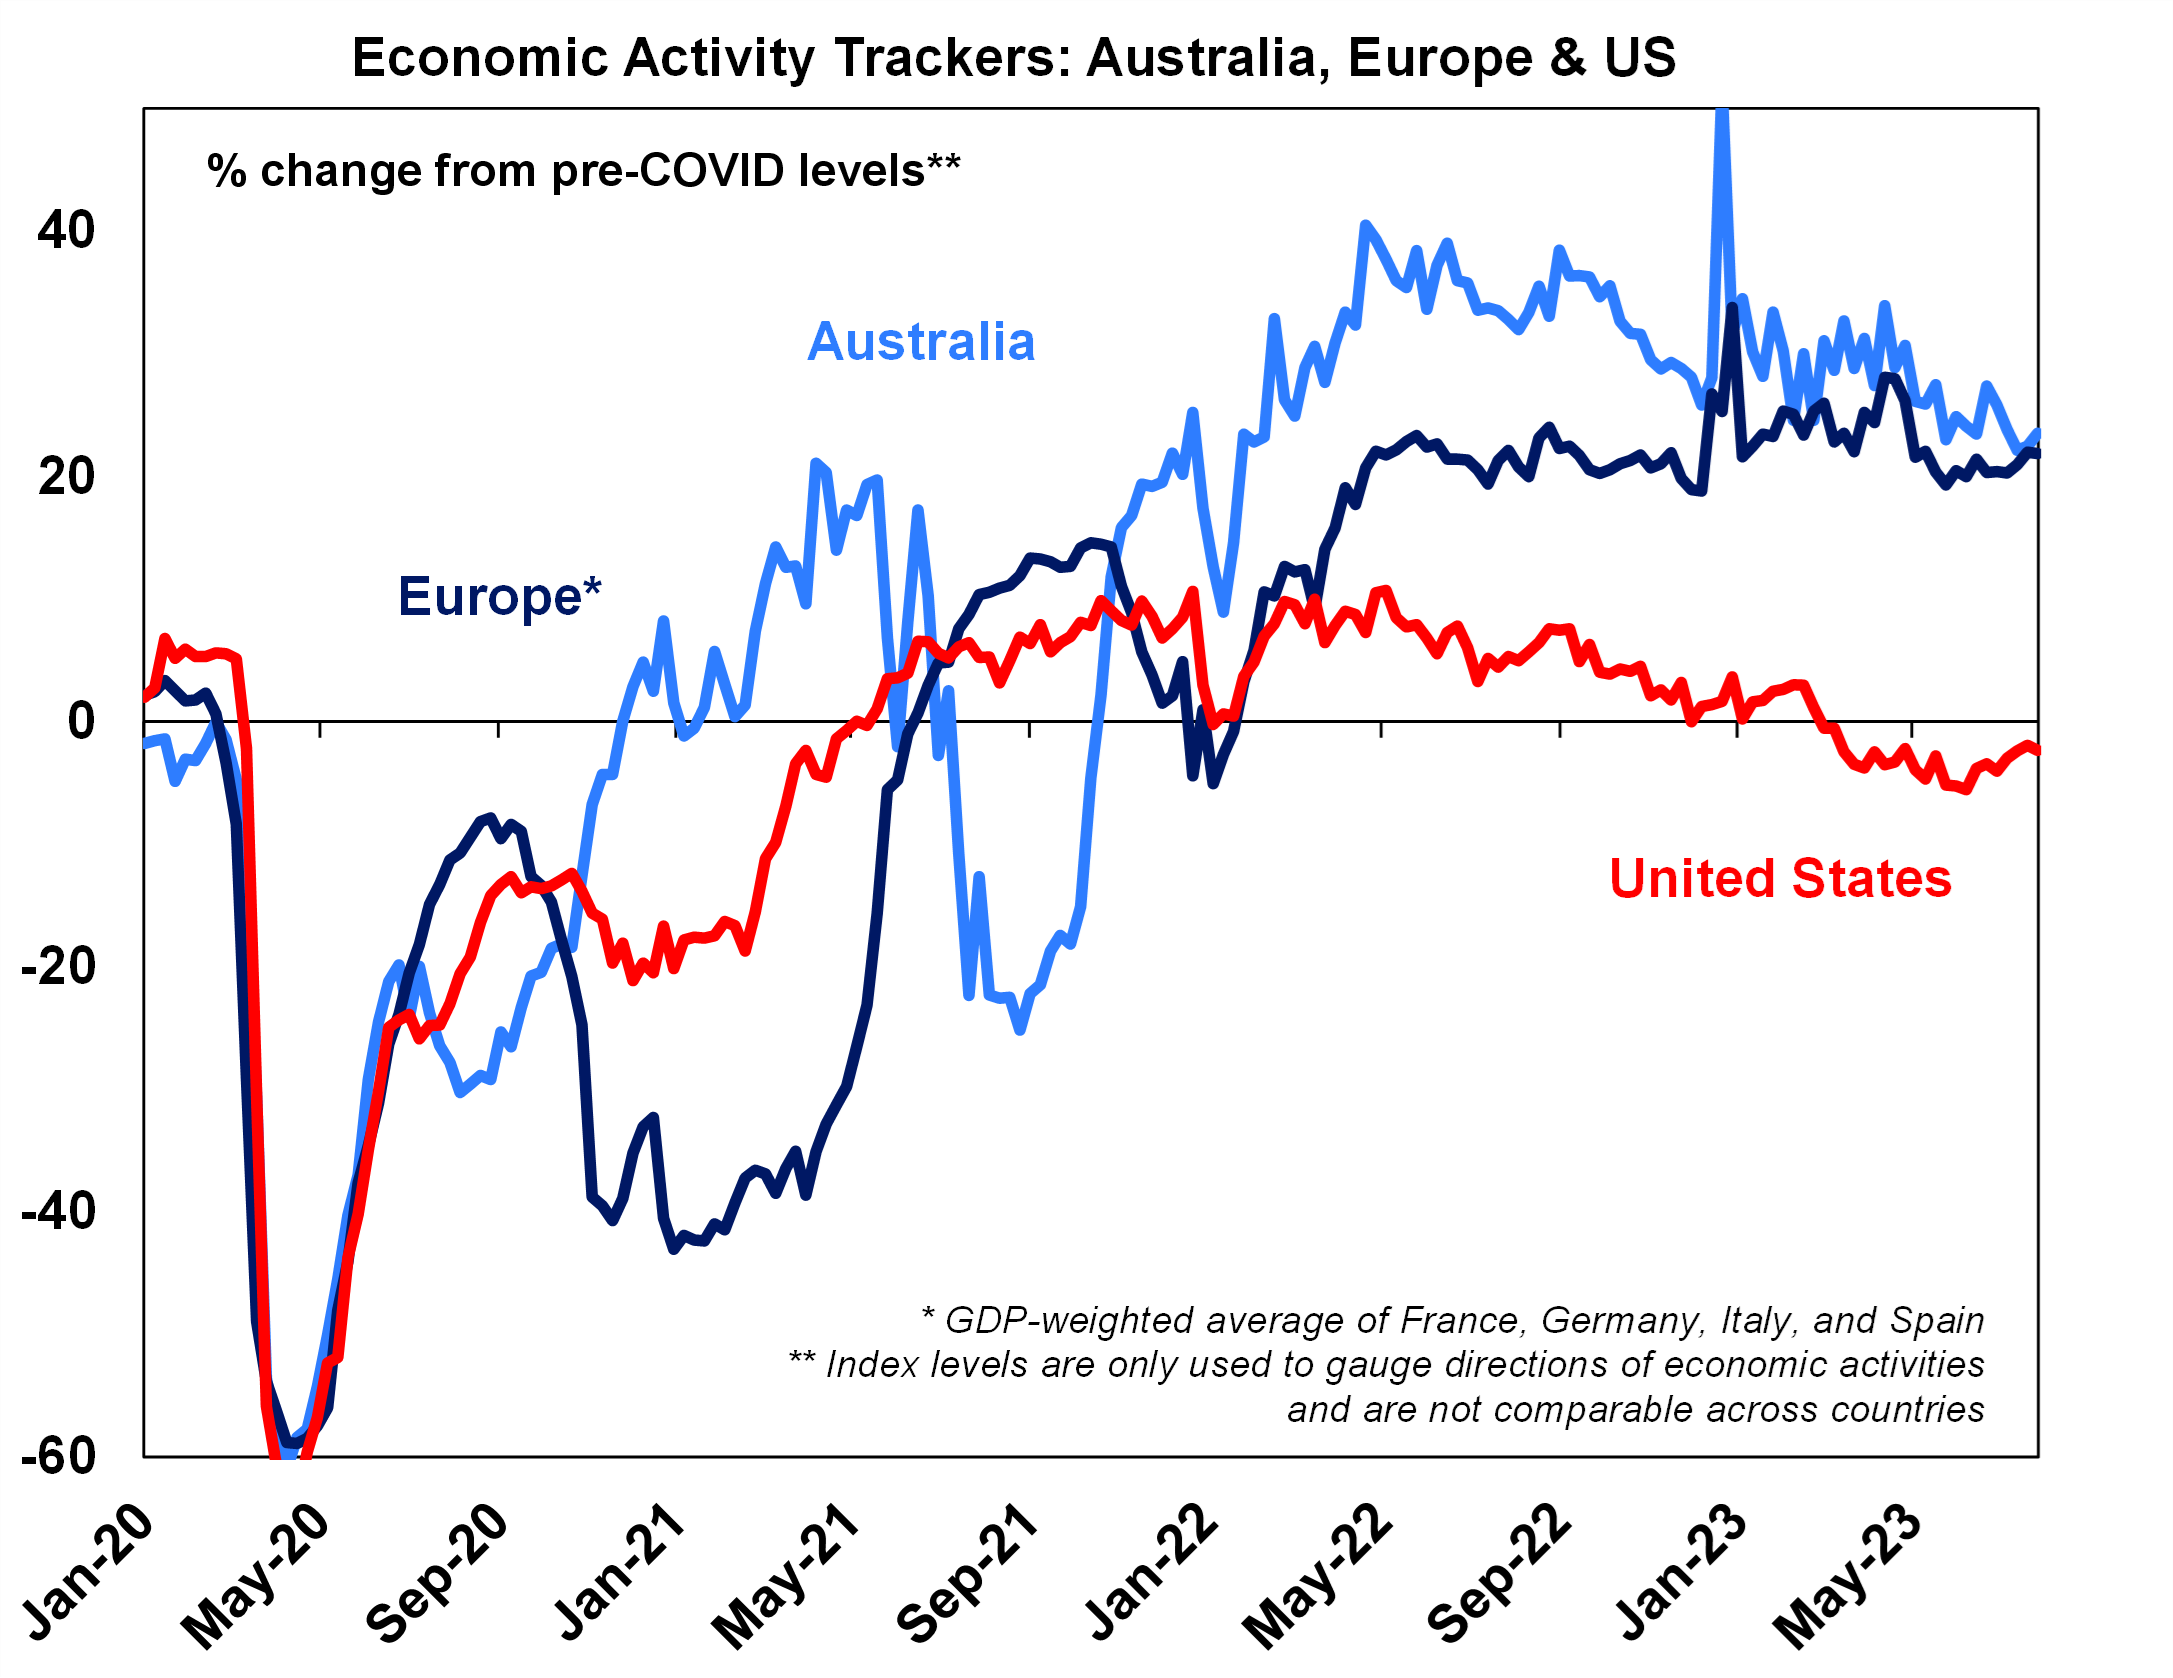
Based on weekly data for eg job ads, restaurant bookings, confidence, mobility, credit & debit card transactions, retail foot traffic, hotel bookings. Source: AMP
Major global economic events and implications
- US second quarter earnings continue to come in better than expected. Around 83% of companies have reported and 80% have beaten earnings expectations (the historical norm is 76%). Expectations are that earnings will fall by around 5.2% over the year to June, which is not consistent with a recession.
- US ADP employment (a leading indicator for non-farm payrolls) rose more than expected in July, but job openings fell in June and the ratio of job openings to the number of people unemployed remained at 1.6 which is down from its high of ~2% in the post-pandemic cycle but still very elevated compared to history indicating that there the labour market is still tight. The “quits” rate fell to 2.4% (as a share of employment) which is also down from its recent high but above its historical average (see the chart below). The labour market is cooling, but it’s occurring gradually which is positive in terms of keeping the unemployment rate but also means that there is upward pressure on wages.
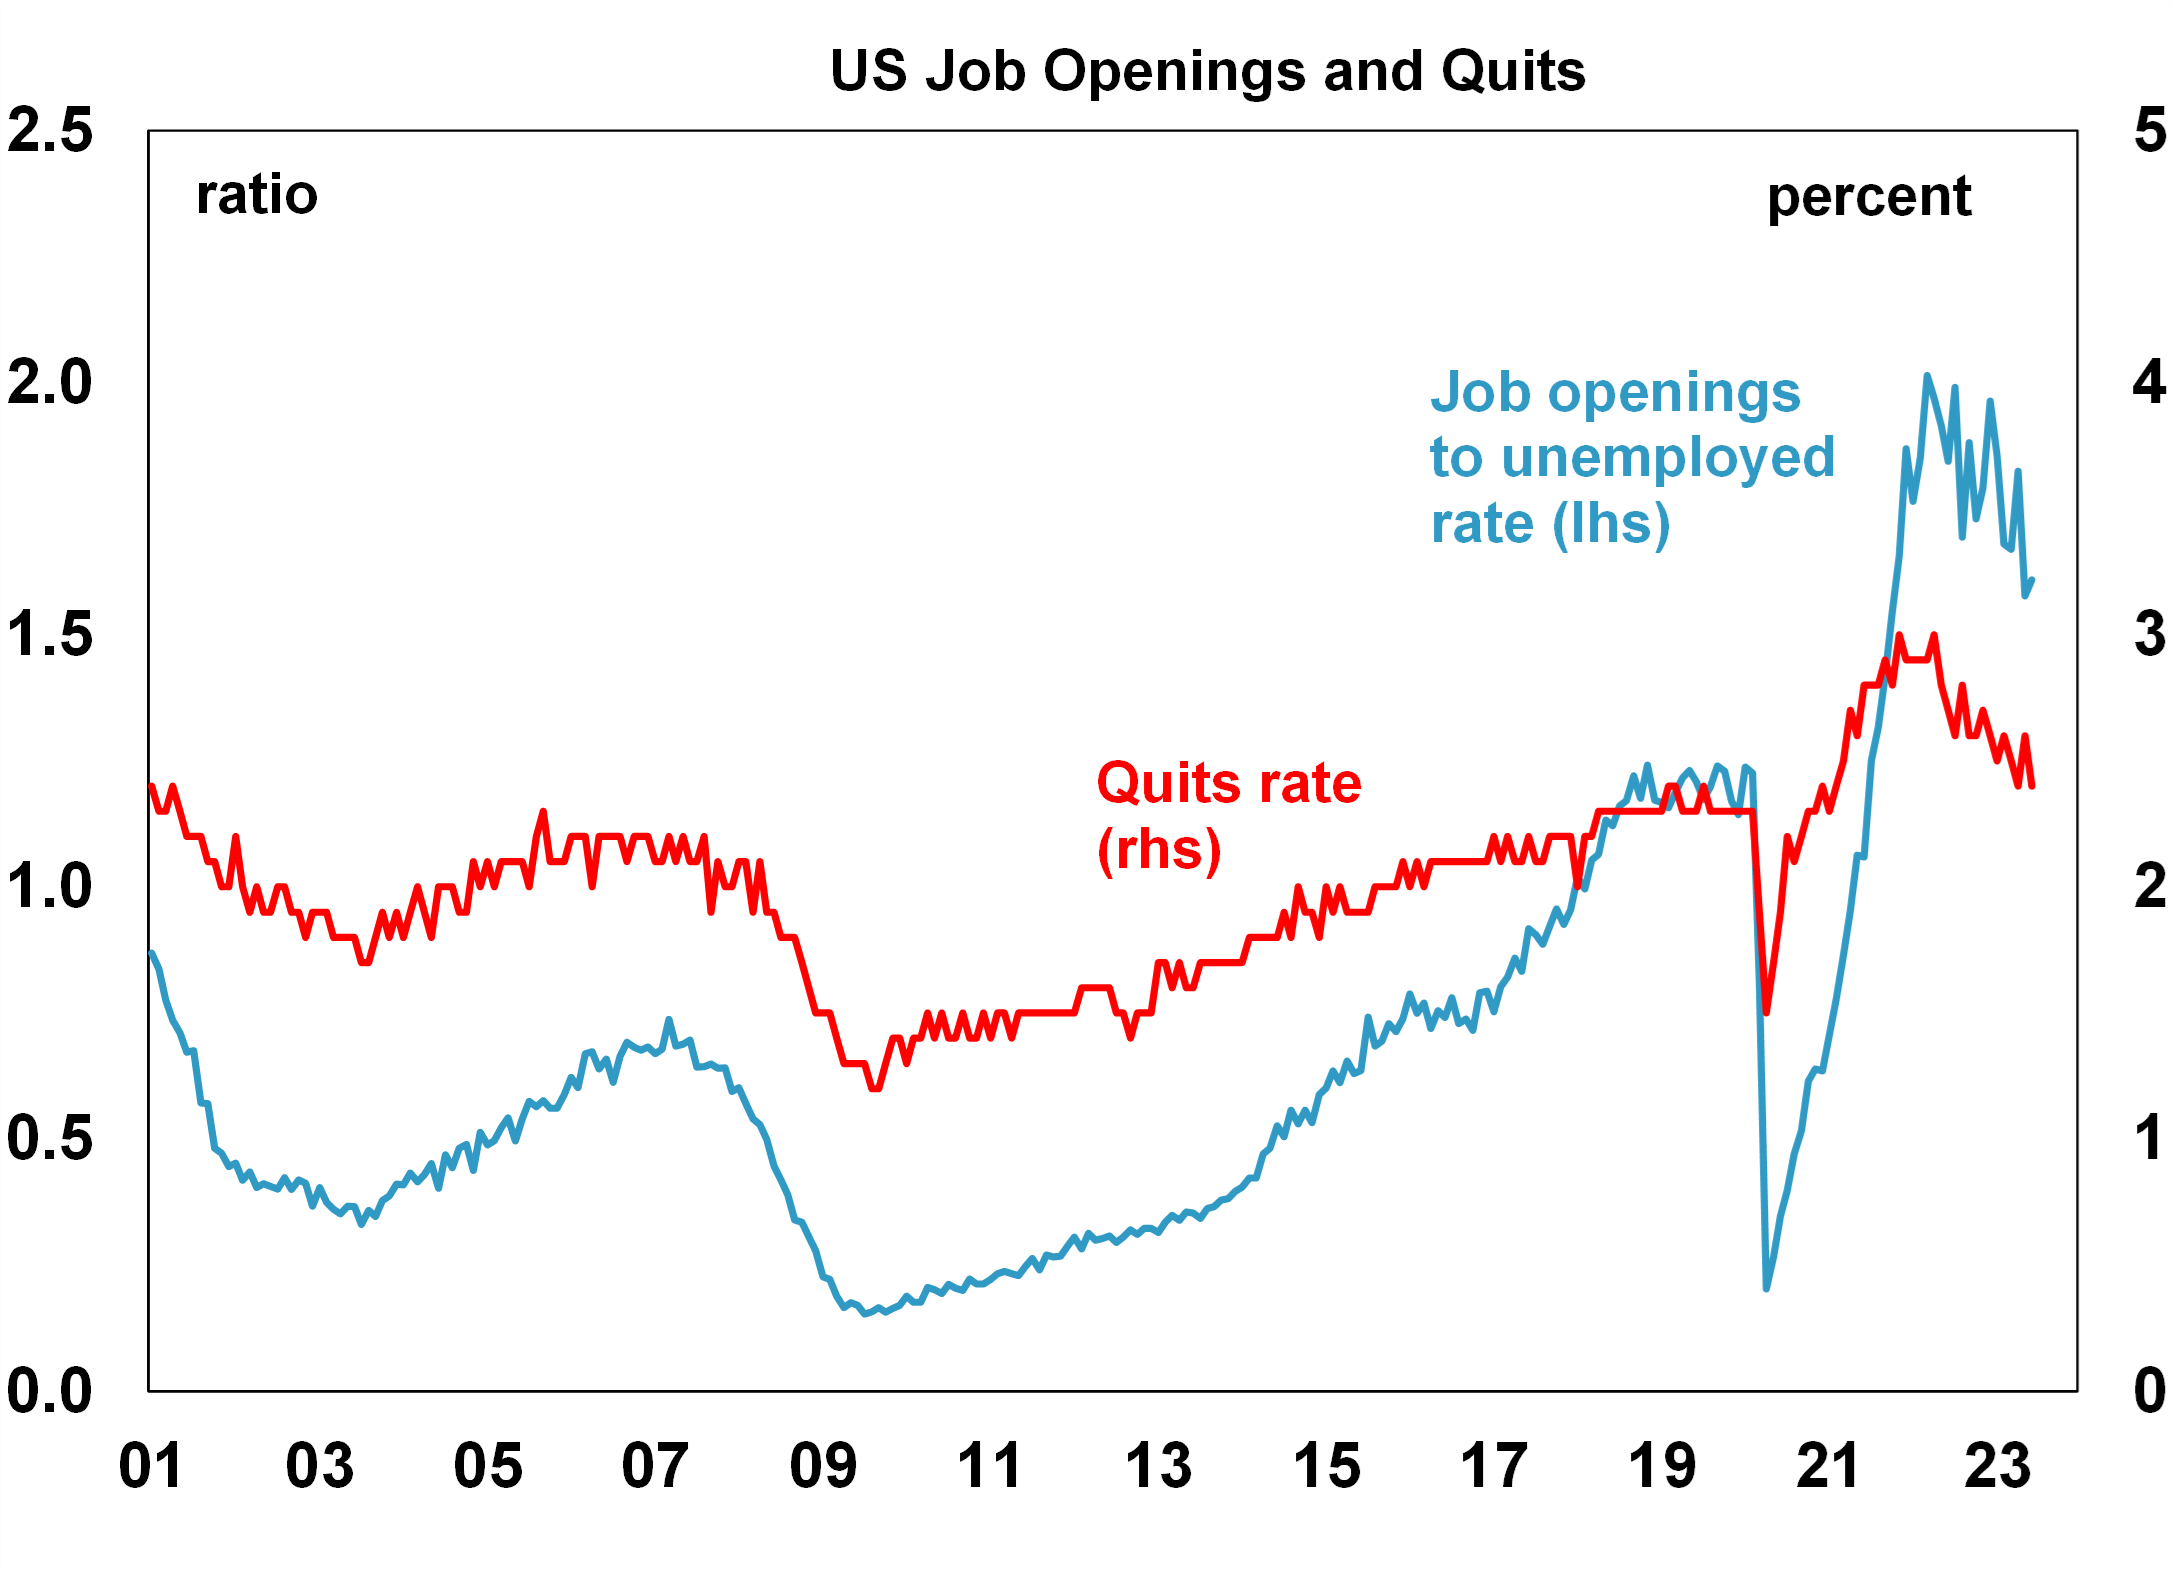
Source: Macrobond, AMP
- The US ISM manufacturing index remained low in July, coming in at 46.4 from 46.0 last month and disappointing expectations. This is similar to the signal from the manufacturing PMI (see the chart below). The services ISM index also fell in July to 52.7 (from 53.9 last month) but is still in positive “expansionary” territory. The prices paid components in both indices increased this month.
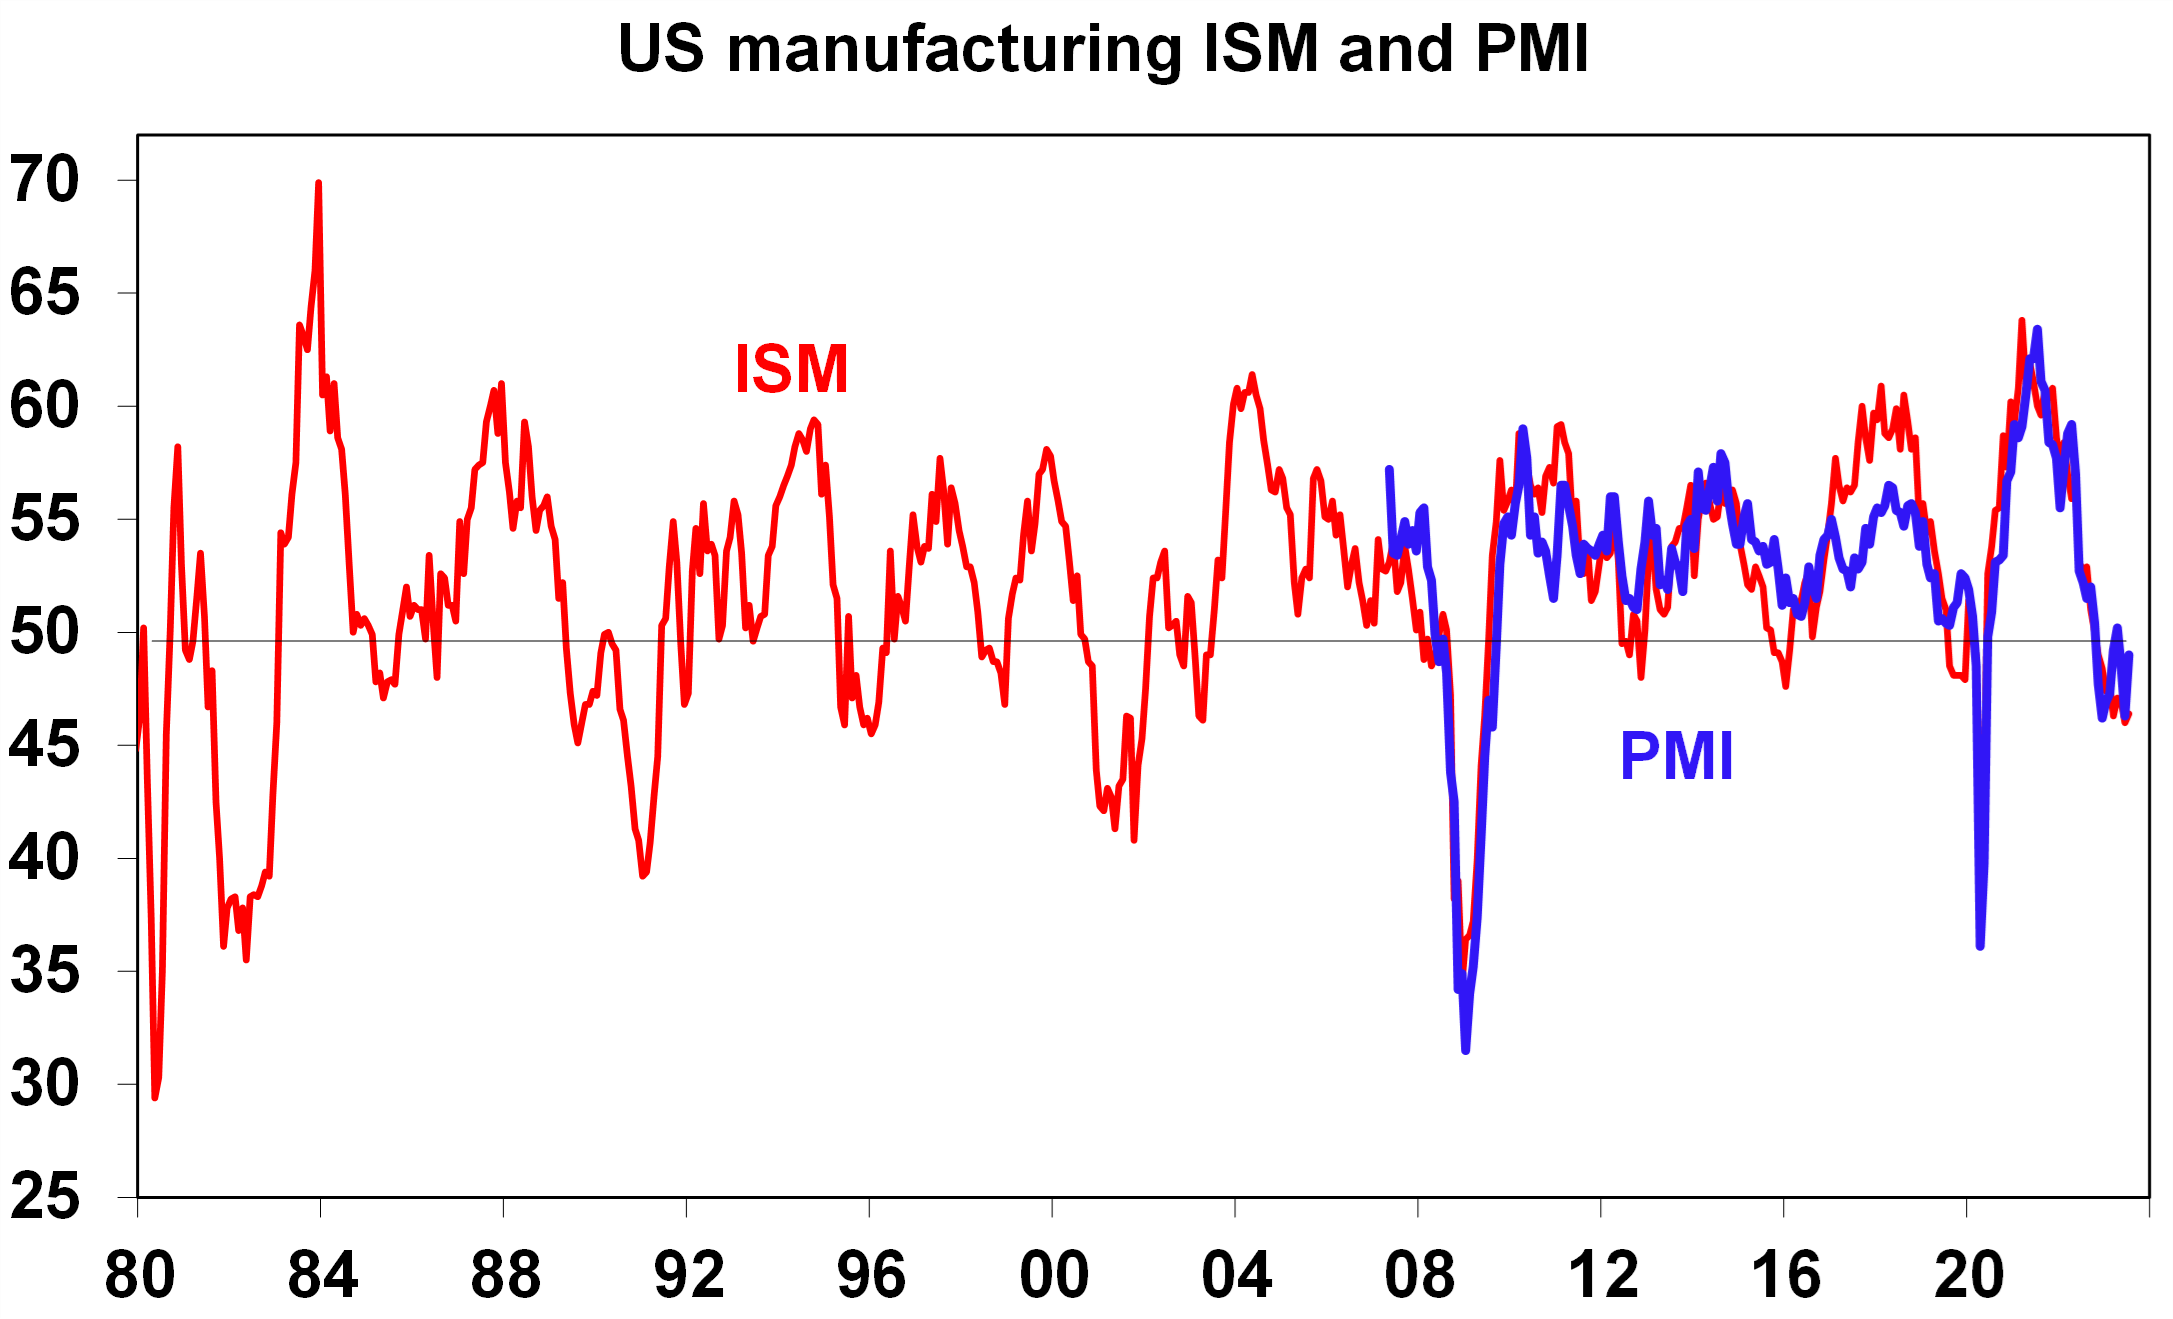
Source: Bloomberg, AMP
- The Fed’s Senior Loan Officer’s Survey for the September quarter showed that bank credit conditions tightened again across both small and large firms, but only modestly (see the chart below) which indicates that the banking crisis earlier in the year did not lead to the broader credit crunch initially feared.
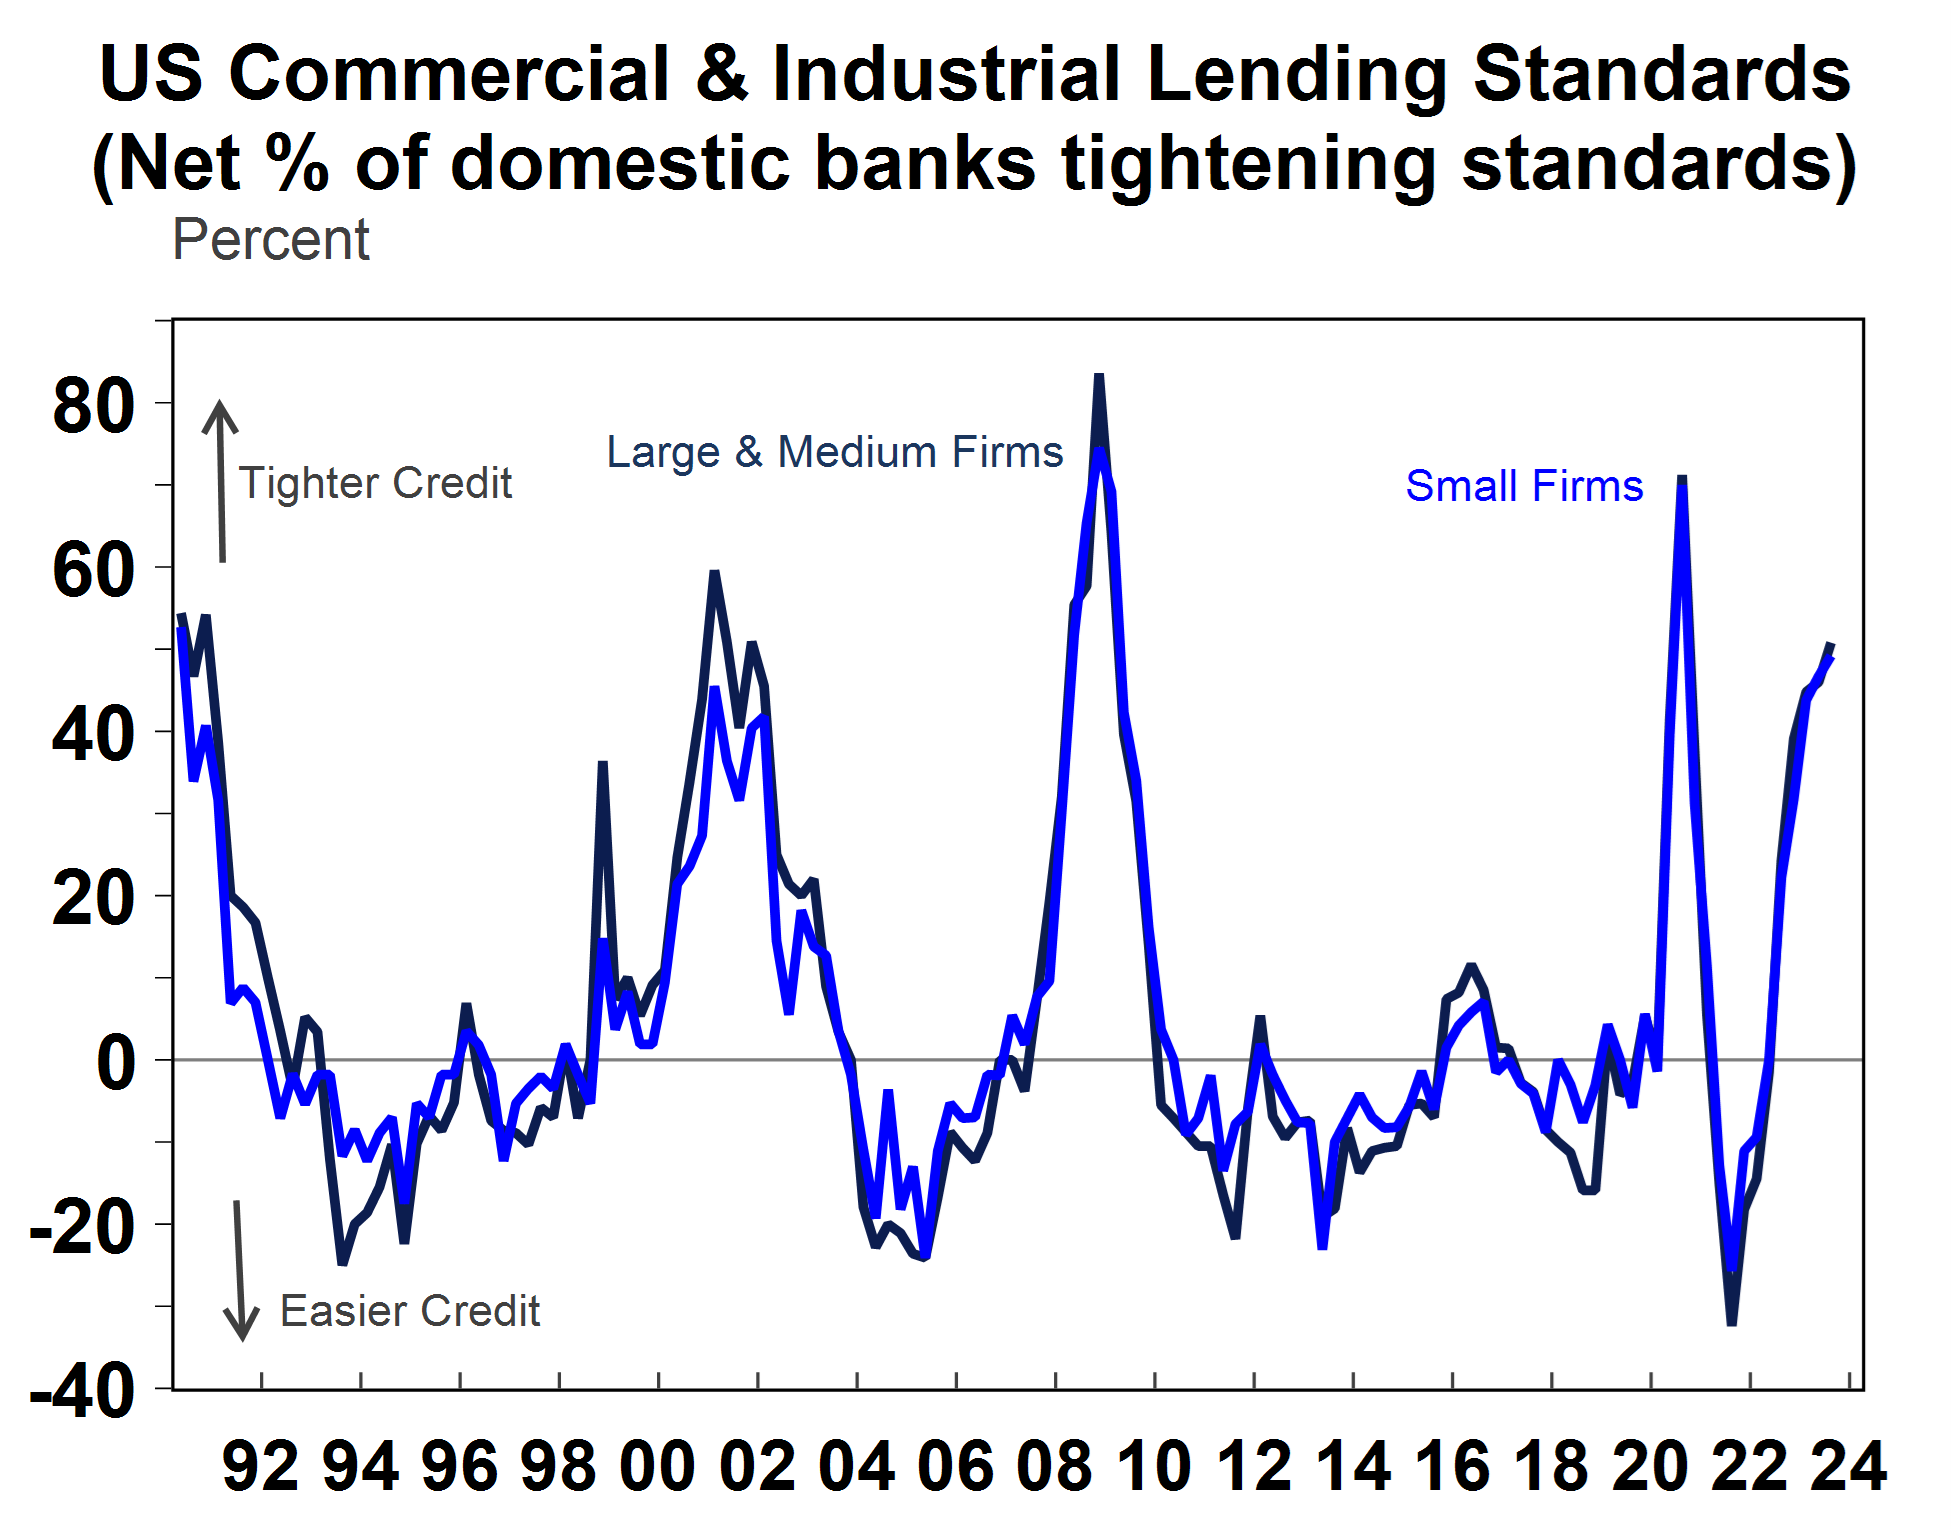
Source: Macrobond, AMP
- In China, the Caixin manufacturing PMI fell to 49.2, below the “neutral” level of 50 and similar to the signal from the official manufacturing PMI while the Caixin services PMI rose to 54.1 (from 53.9 last month). The Caixin data differs from the official PMI’s because it surveys smaller firms. The Chinese growth indicators from the PMI’s have been trending down recently (see chart below).

Source: Macrobond, AMP
- Global employment data this week showed that Japan’s unemployment rate was lower than expected in June at 2.5%, the Eurozone unemployment rate was 6.4%, unchanged from last month and around its post-pandemic low.
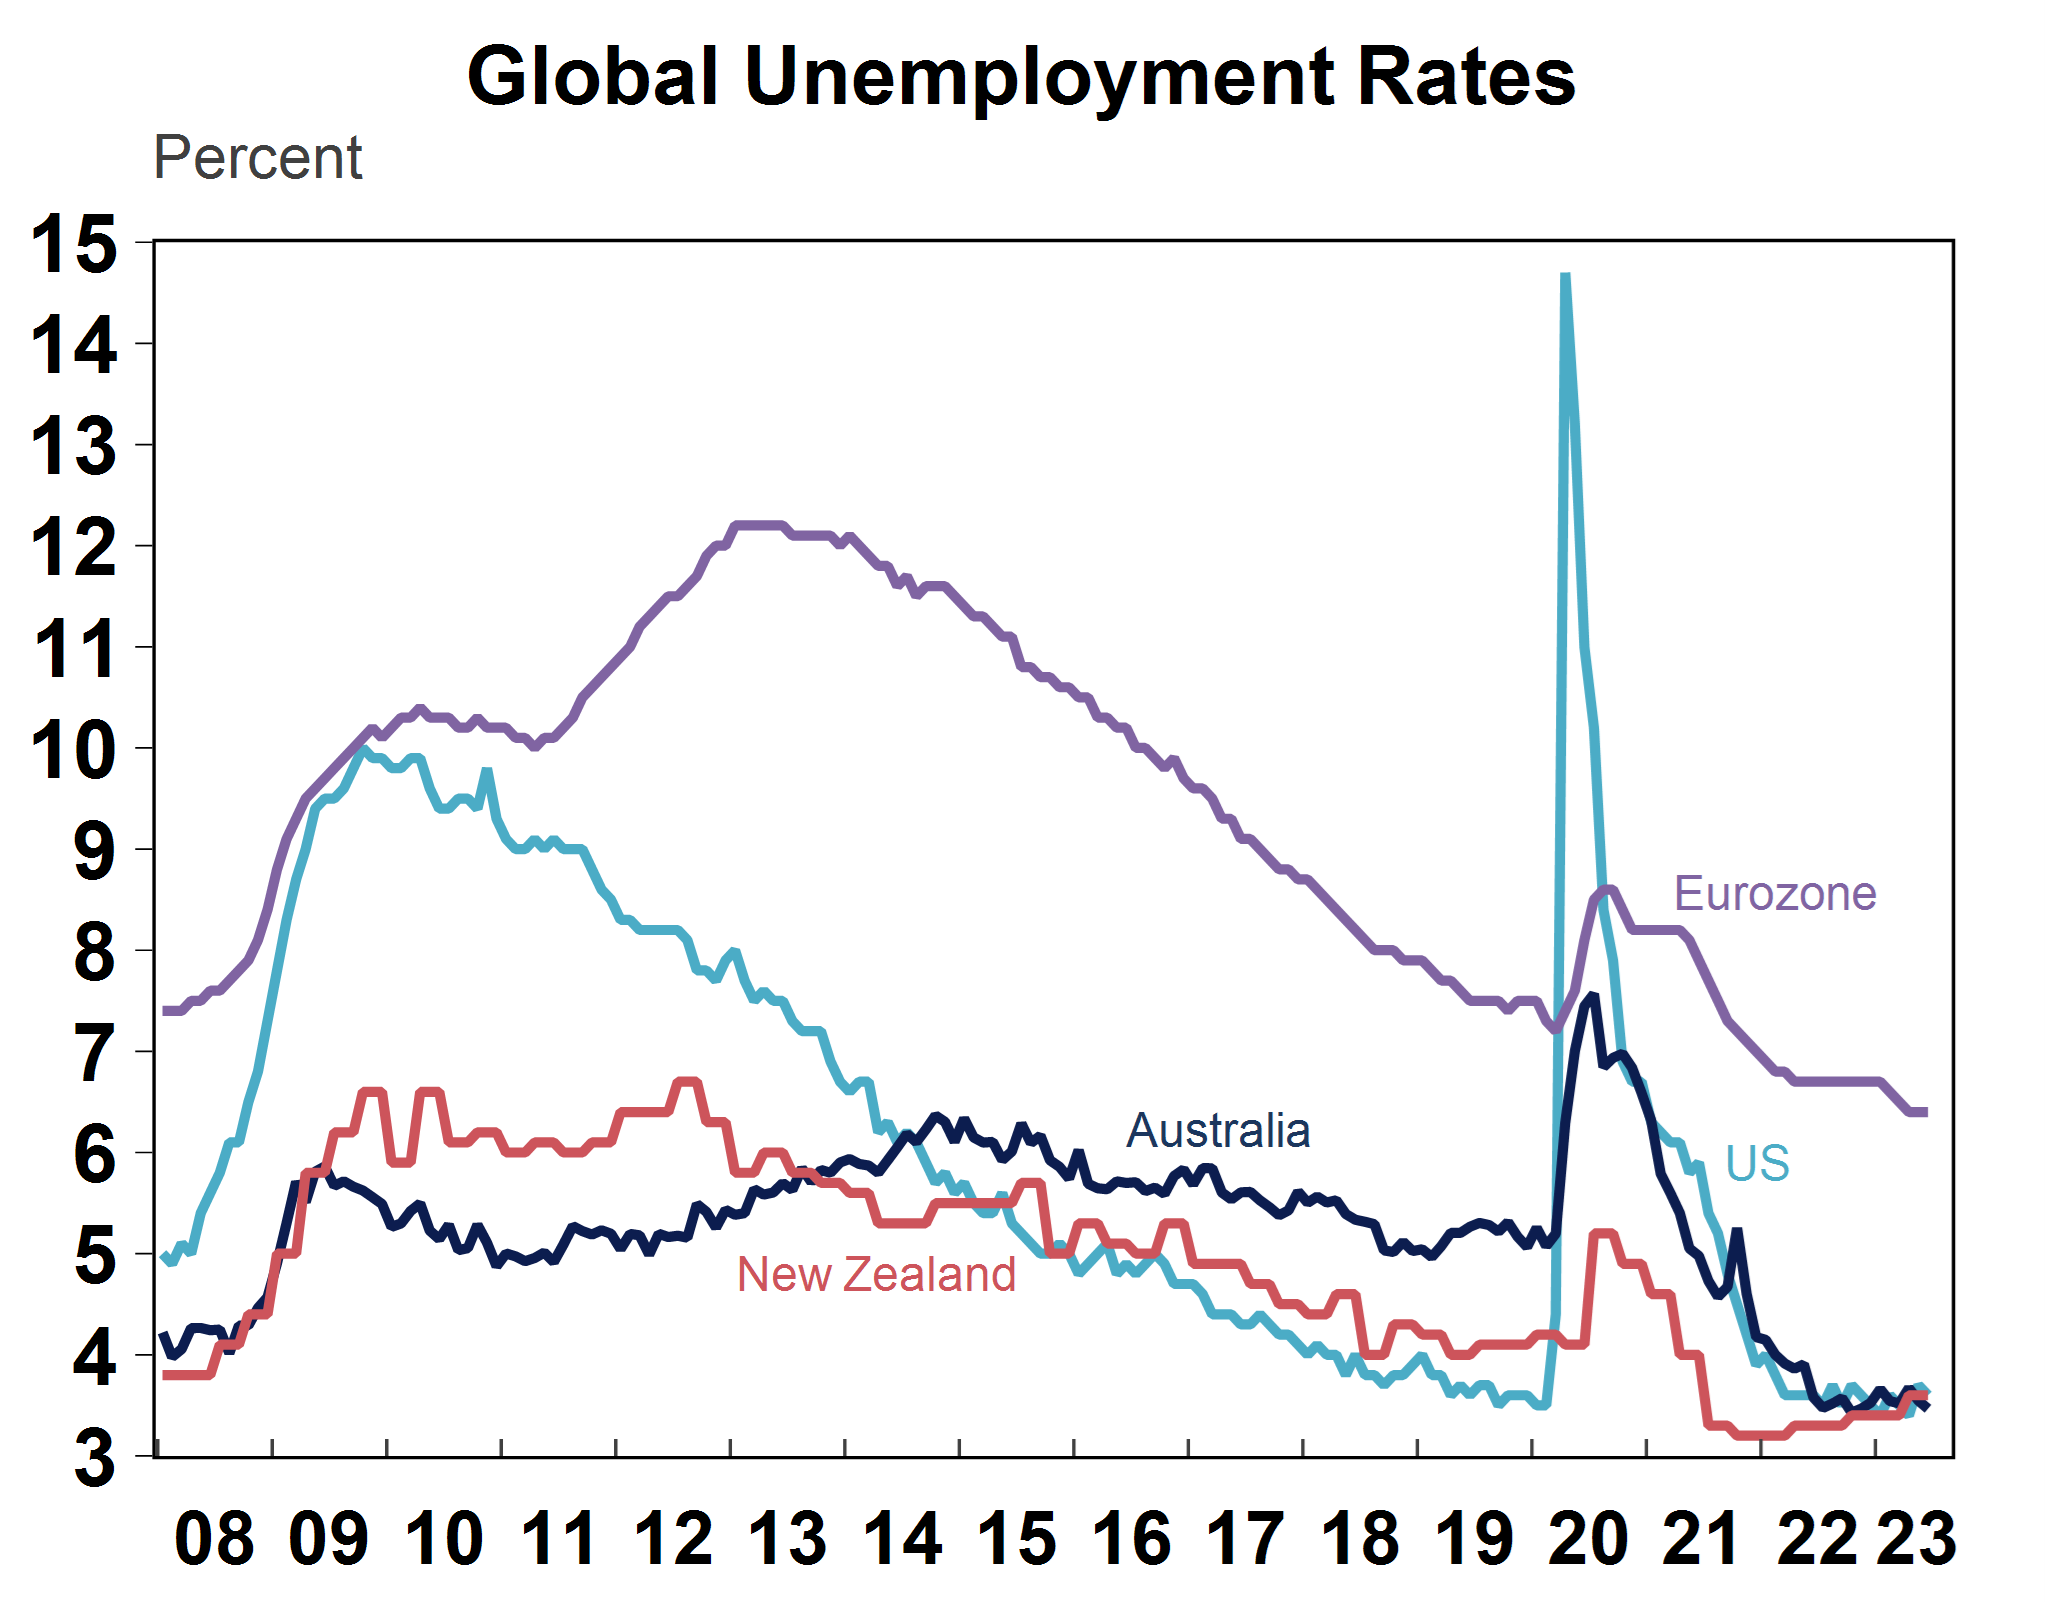
Source: Macrobond, AMP
- Eurozone GDP rebounded by 0.3% in the June quarter after a flat March quarter. GDP is up by 0.6% over the year to June.
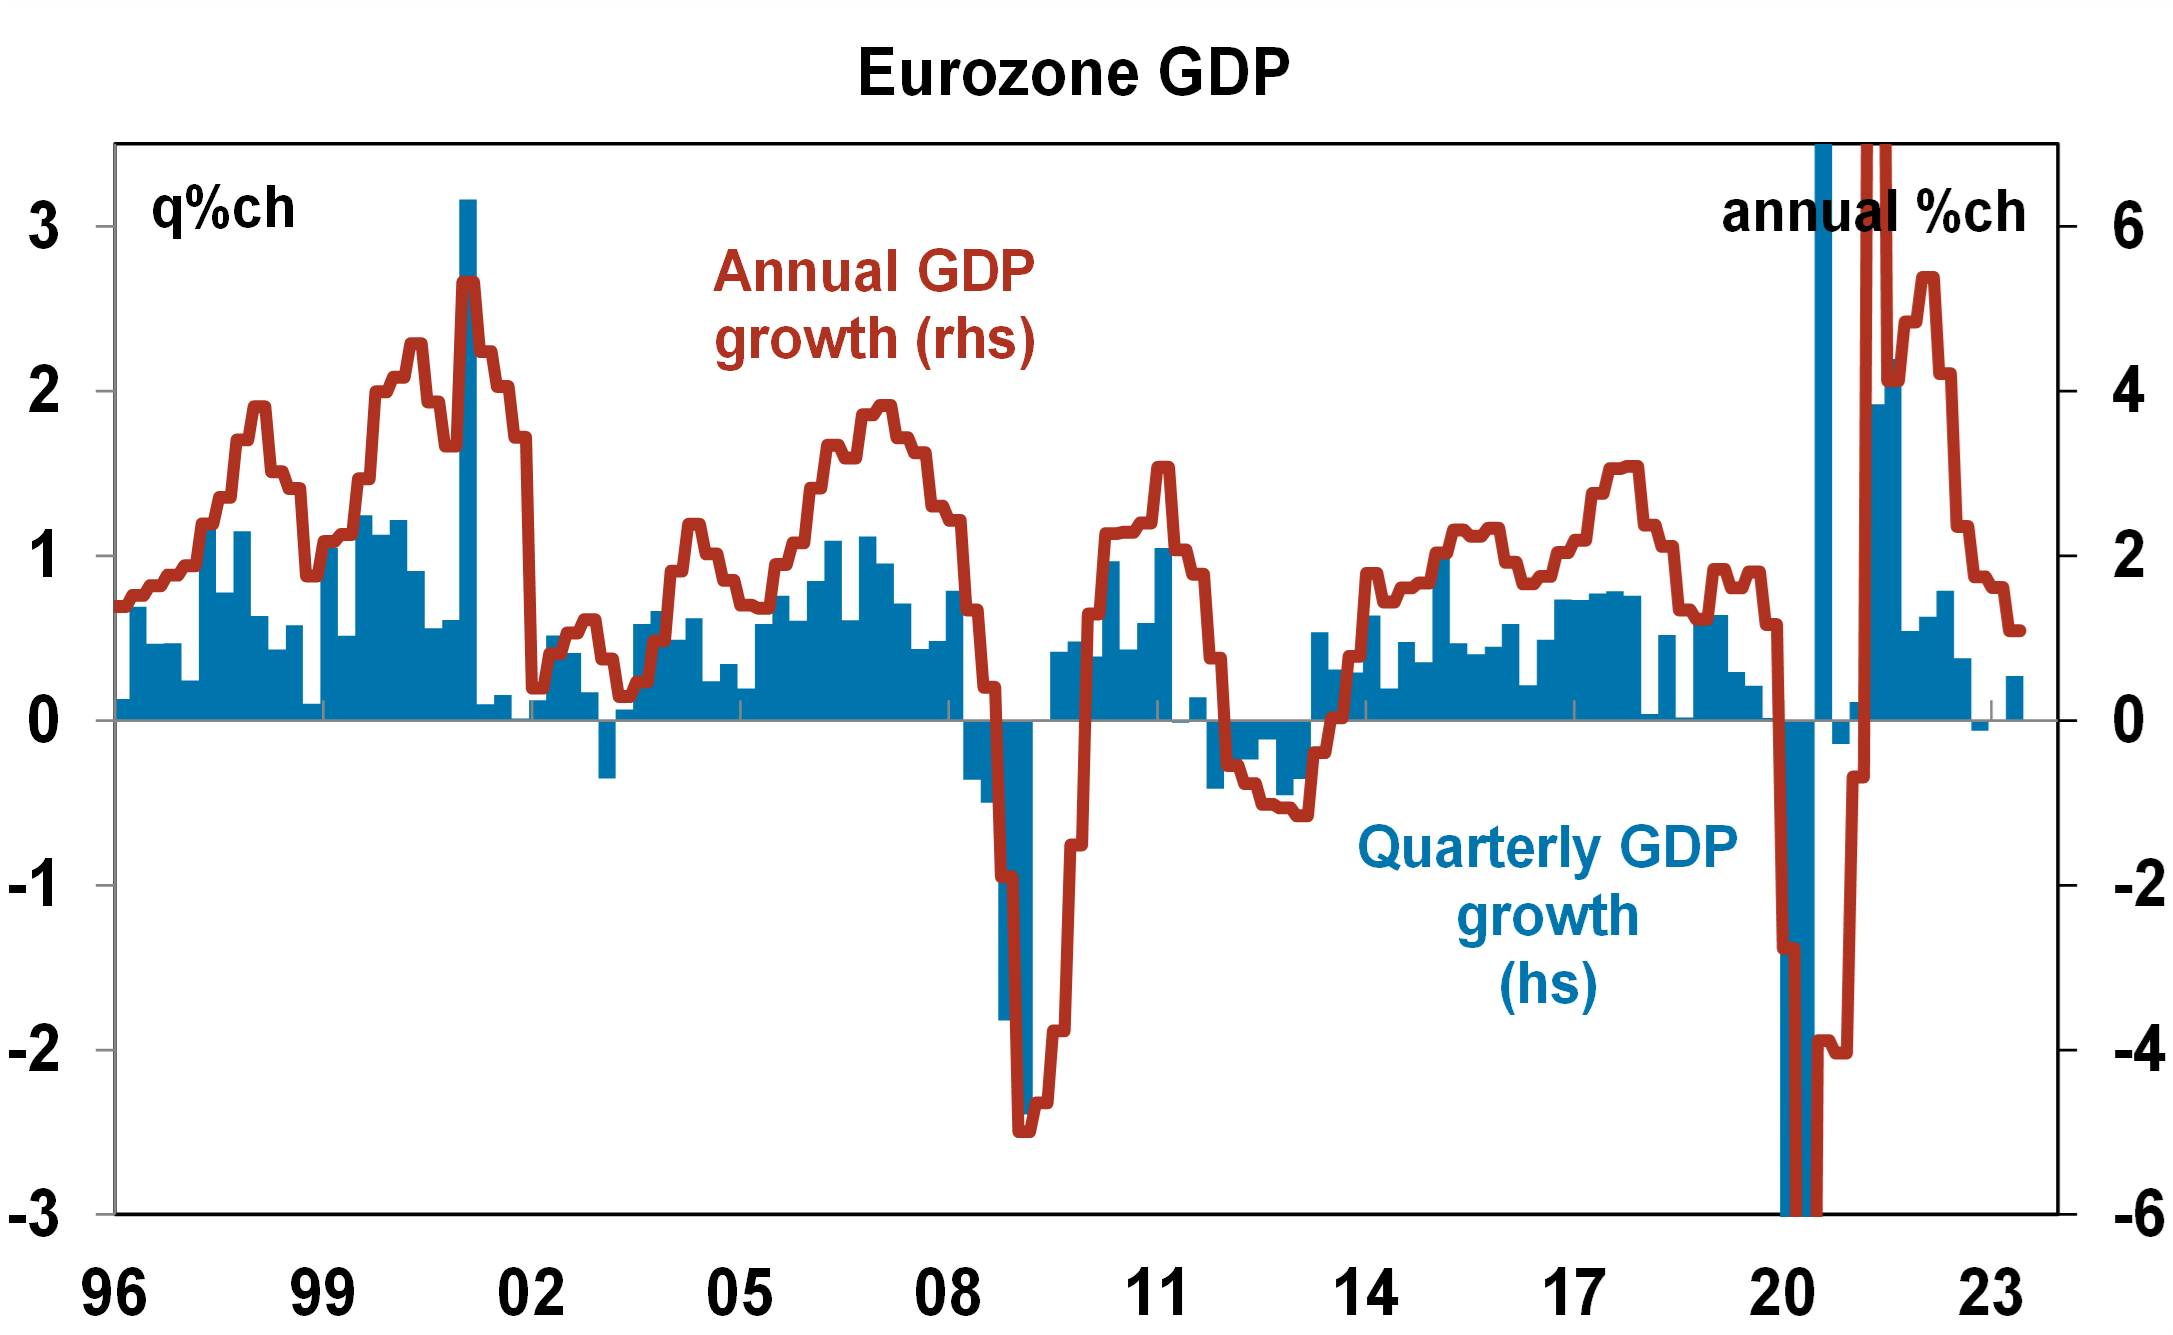
Source: Bloomberg, AMP
- More signs of global inflation slowing with the Eurozone consumer price index down by 0.1% in July or 5.3% over the year. Core consumer prices are up by 5.5% over the year to July.
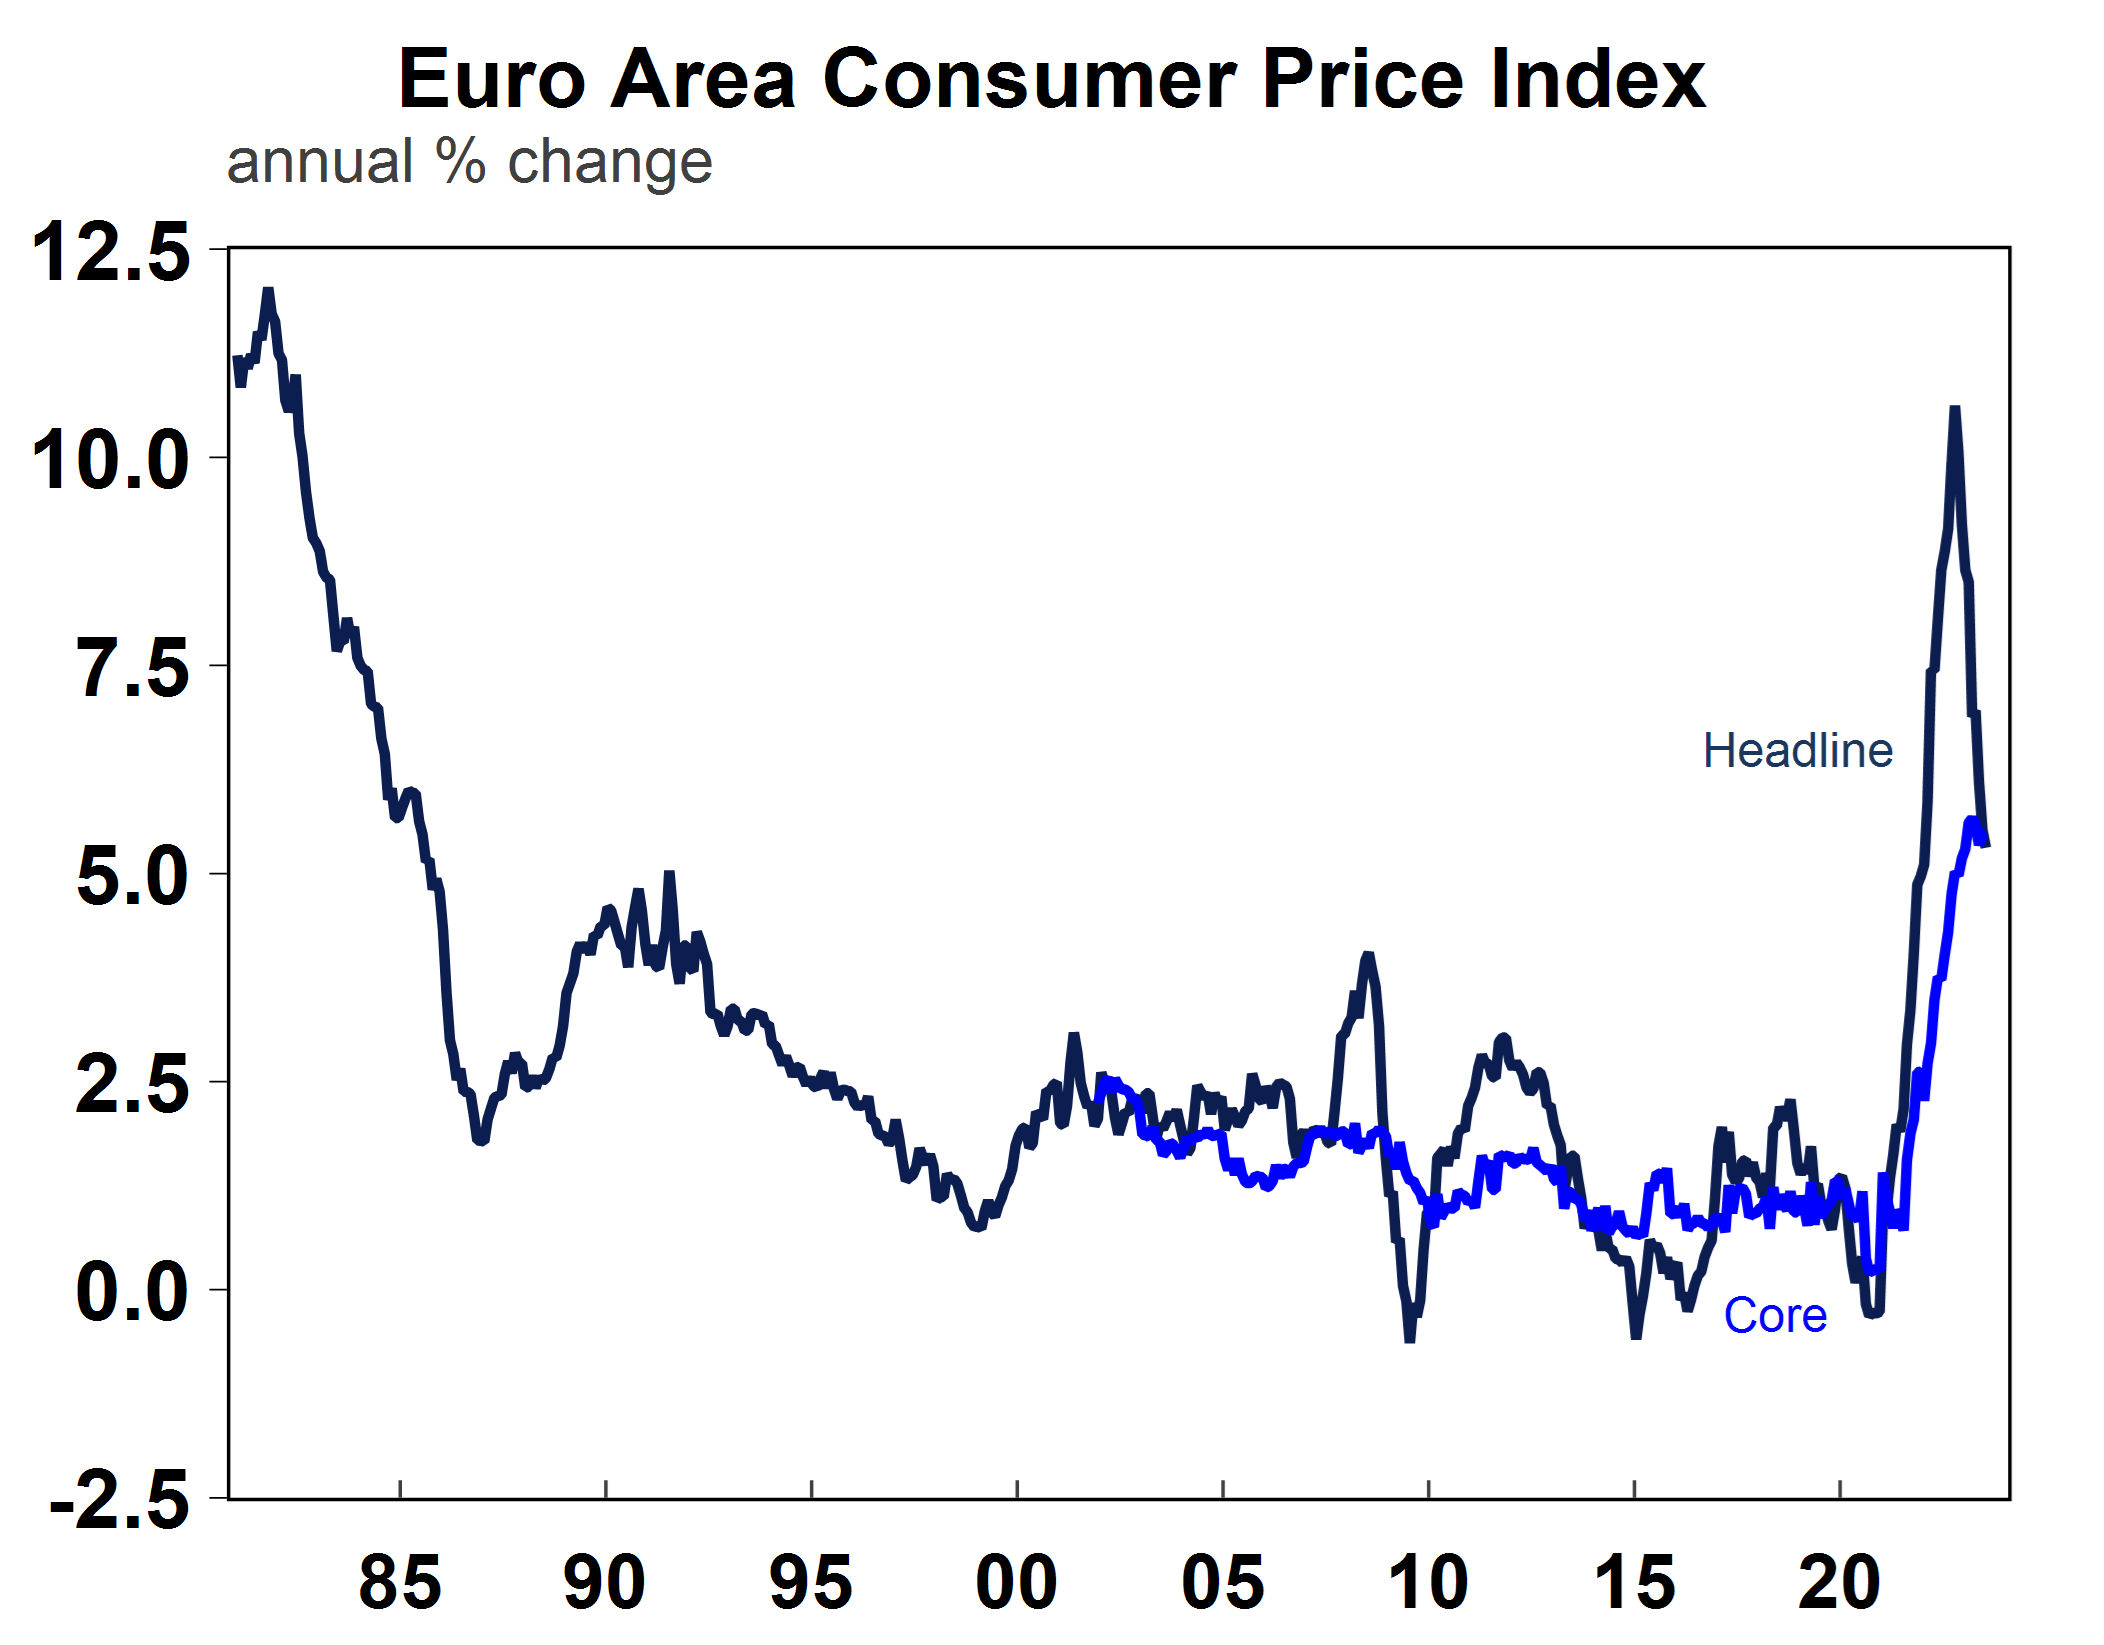
Source: Macrobond, AMP
- The Bank of England (BoE) hiked interest rates by 0.25% which was expected, taking the bank rate to 5.25% and taking the total increase in interest rates to 5.15%. Another two 0.25% rate hikes are expected from the BoE over coming months. UK interest rate increases are around the same pace as the US and New Zealand (see the chart below).

Source: Macrobond, AMP
Australian economic events and implications
- The RBA left the cash rate on hold at 4.1% for the second month in a row, which was in line with views that thought it would be a close call between a hike and a pause but the hold from the central bank surprised consensus economist views. The RBA retained its tightening bias, citing the still high inflation backdrop and tight labour market but mentioned the downside risks to the economic outlook flowing from the lags with monetary policy. The recent June quarter inflation data were lower than expected and it was consistent with the RBA’s projections of inflation being back in the 2-3% target range in 2025. Given the increasing signals that rate hikes are working to slow economic growth including falling retail spending, declines in building approvals, slowing GDP growth, declining business confidence, negative consumer confidence, indications of a slowing jobs market and the decline in inflation it makes sense for the RBA to sit back over the next few months to assess the impacts of prior rate hikes.
- Today, the RBA released the Statement on Monetary Policy which includes updates to the bank’s central forecasts. There were few changes to forecasts (see the table below). GDP growth was revised down slightly (our own forecasts are for even lower GDP growth of 0.9% year on year by Dec-23 and 0.7% by June-24). Near-term inflation forecasts were also revised lower and there was a very slight increase to inflation in the out-years (which doesn’t even look like an upgrade in the table below due to rounding), with annual headline inflation expected to be at the top end of the RBA’s target band by 2025 (we remain of the view that inflation will surprise to the downside and see headline inflation at the top end of the 2-3% inflation target by the September quarter next year). The wages forecasts (not included in the table) were revised up slightly to show a peak of 4.1% by December 2023.
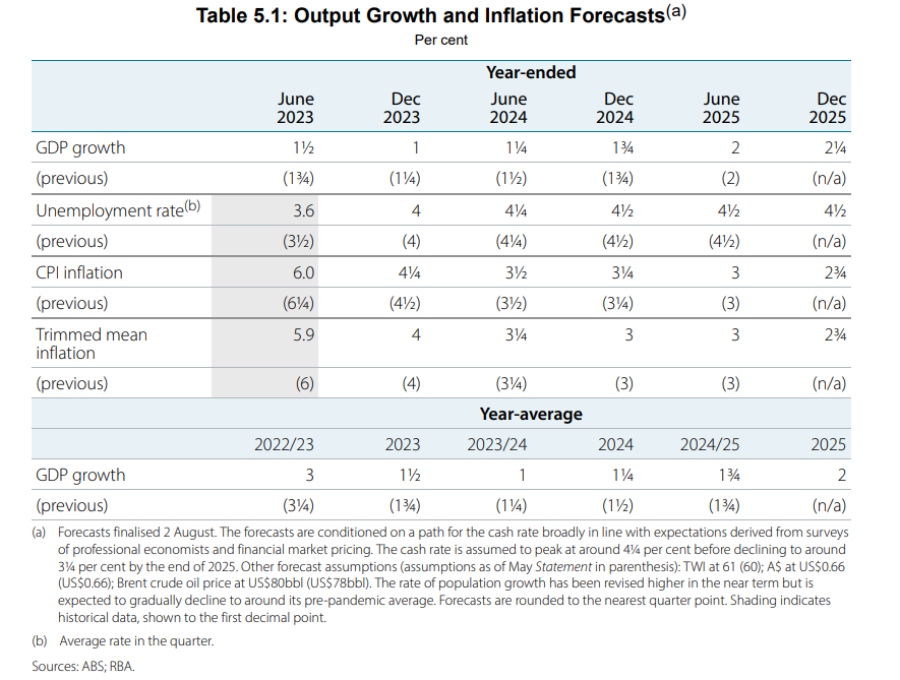
Source: RBA, AMP
- The commentary indicated that the Board did consider raising interest rates in both the July and August meetings but decided instead to keep rates on hold because: the already significant lift in interest rates was slowing economic growth and resulting in lower inflation, the full effects of interest rate increases were yet to be fully seen because of the typical lags associated with interest rate increases and keeping rates unchanged would help to preserve gains in the labour market. The RBA also noted that the risks to the inflation outlook are now “broadly balanced” (rather than being to the upside). This means that we are at, or very close to the top for interest rates. The biggest potential upside risk for inflation is if there is a significant positive surprise on wages or employment growth.
- Other data this week included the June building approvals, which fell by 7.7%, after a large rise in the prior month with the weakness coming from the apartment sector. Total approval activity is still low, and approvals are down by 18% on a year ago (see the chart below) which is a major problem in the battle to lift housing supply to ease pressure off rents.
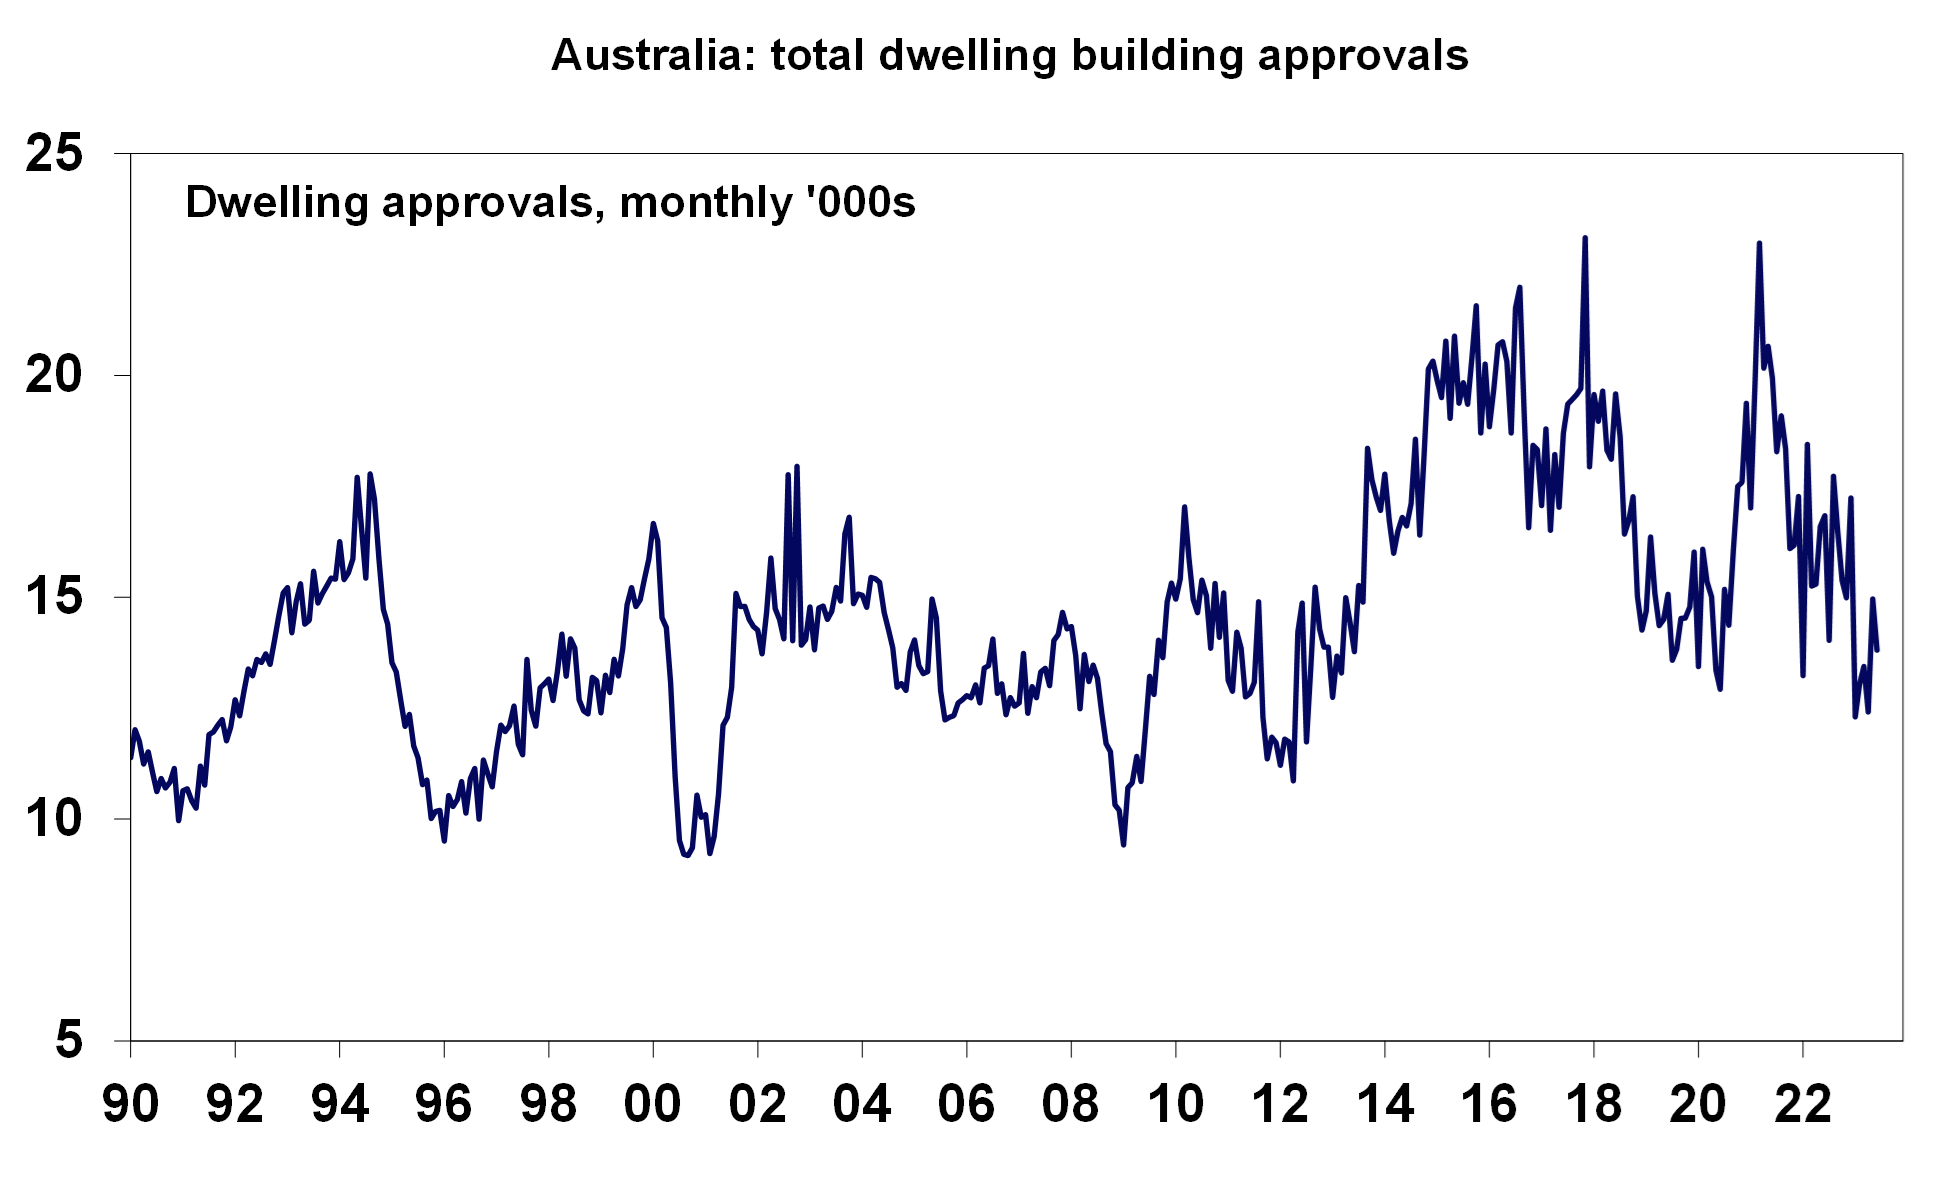
Source: Macrobond, AMP
- The Melbourne Institute monthly inflation gauge rose by 0.8% over July (or 5.4% over the year) which looks like a large lift but this follows a small rise in the prior month which shows the sensitivity of inflation to seasonal impacts and is still consistent with a softening in inflation (see the chart below).
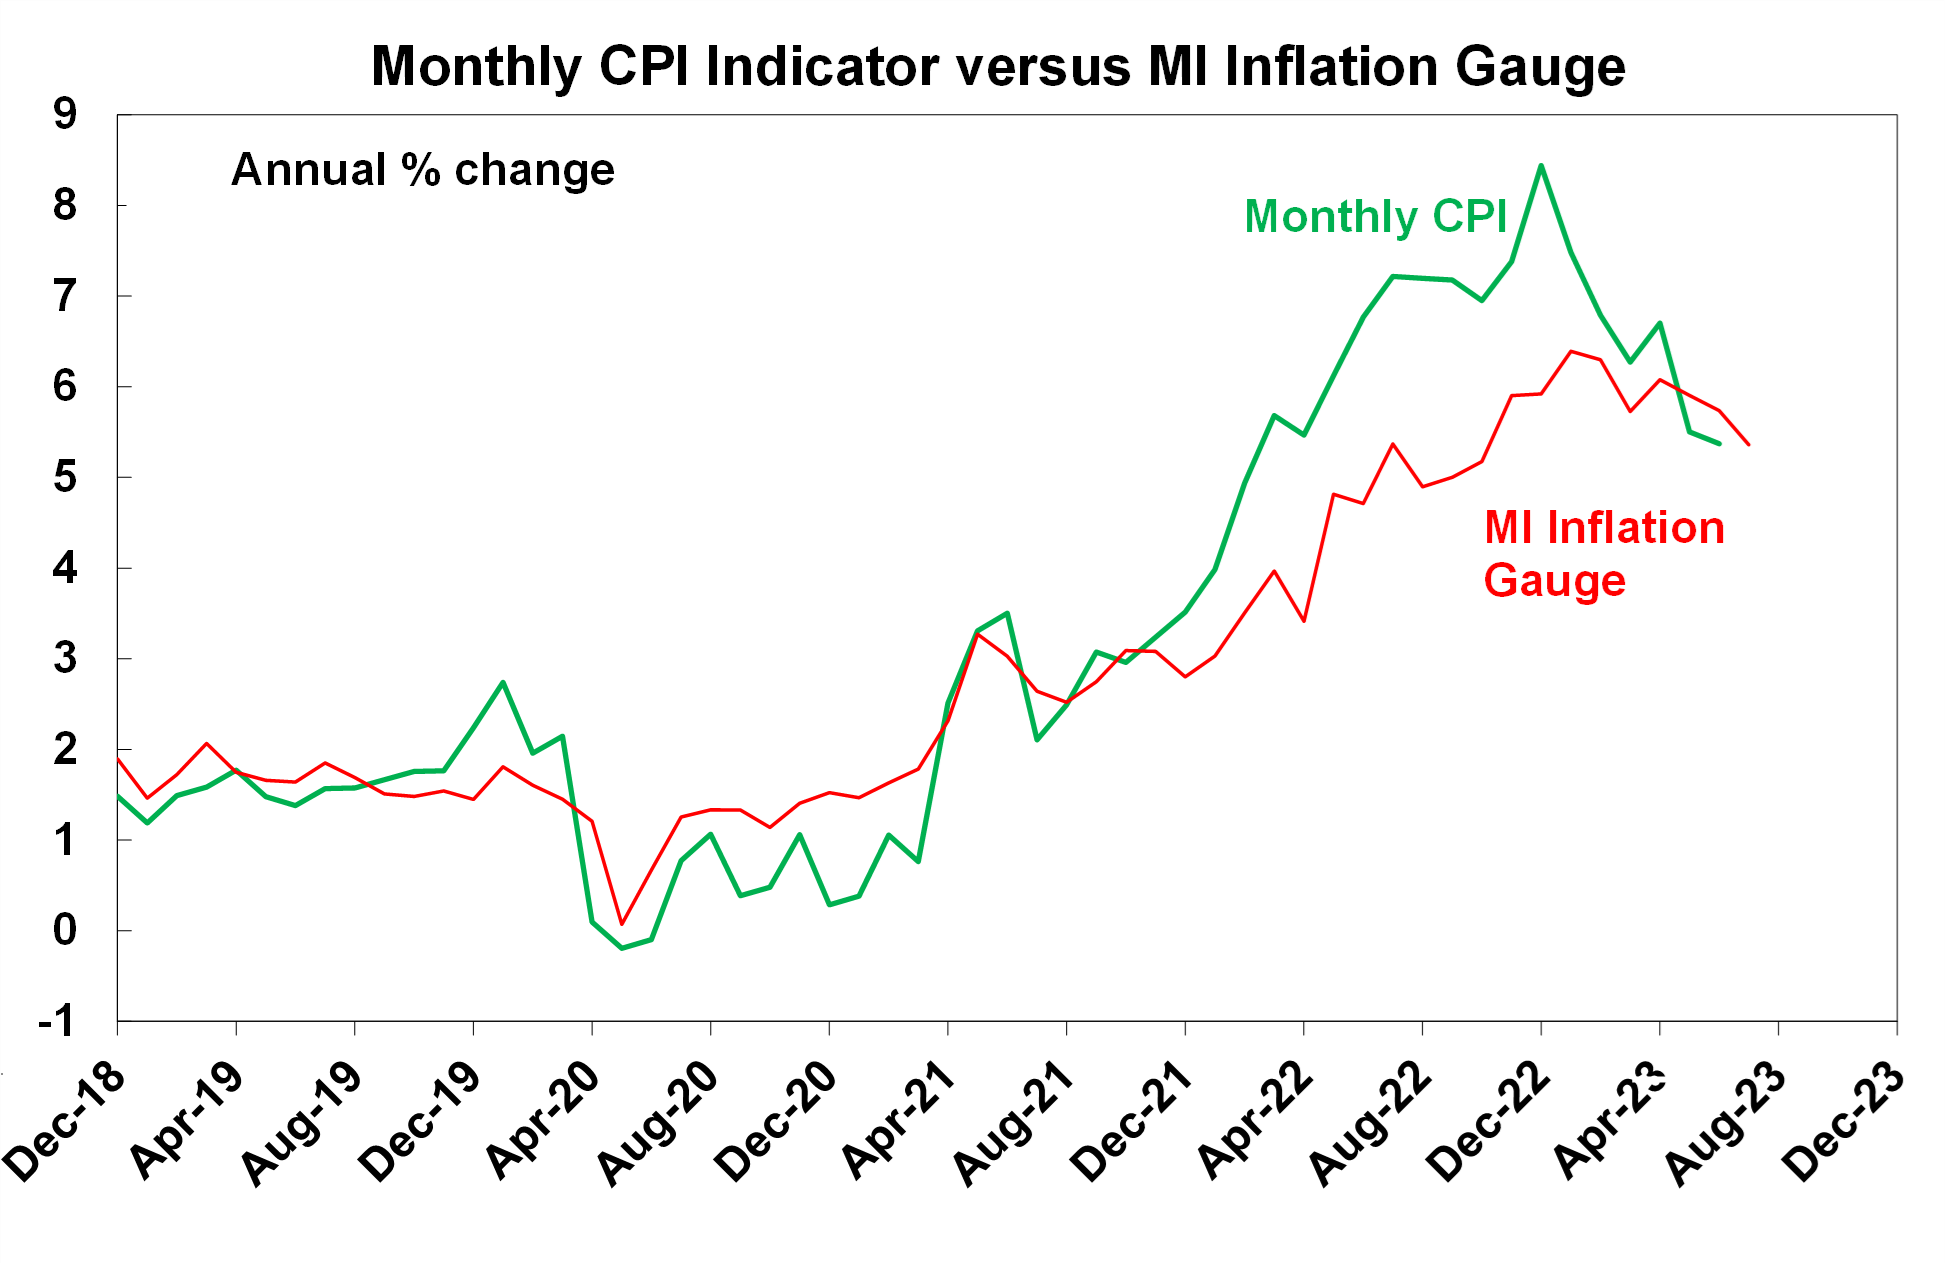
Source: Bloomberg, AMP
- The value of housing lending (which measures the flow of lending) fell by 1% over June with owner-occupied lending down by 2.8% and investor lending up 2.6%. Lending growth has slowed by a massive 18.2% over the past year as the RBA has been raising rates. The RBA private sector credit (which measures the stock of debt) data showed a small 0.2% increase in credit over June or 4.5% over the year, with a 0.4% rise in owner-occupied credit, a 0.1% fall in investor credit (which means investors are paying down debt), a 0.1% rise in other personal credit and a 0.3% rise in business credit. Housing credit growth has declined significantly since the RBA first started raising rates (see the chart below).
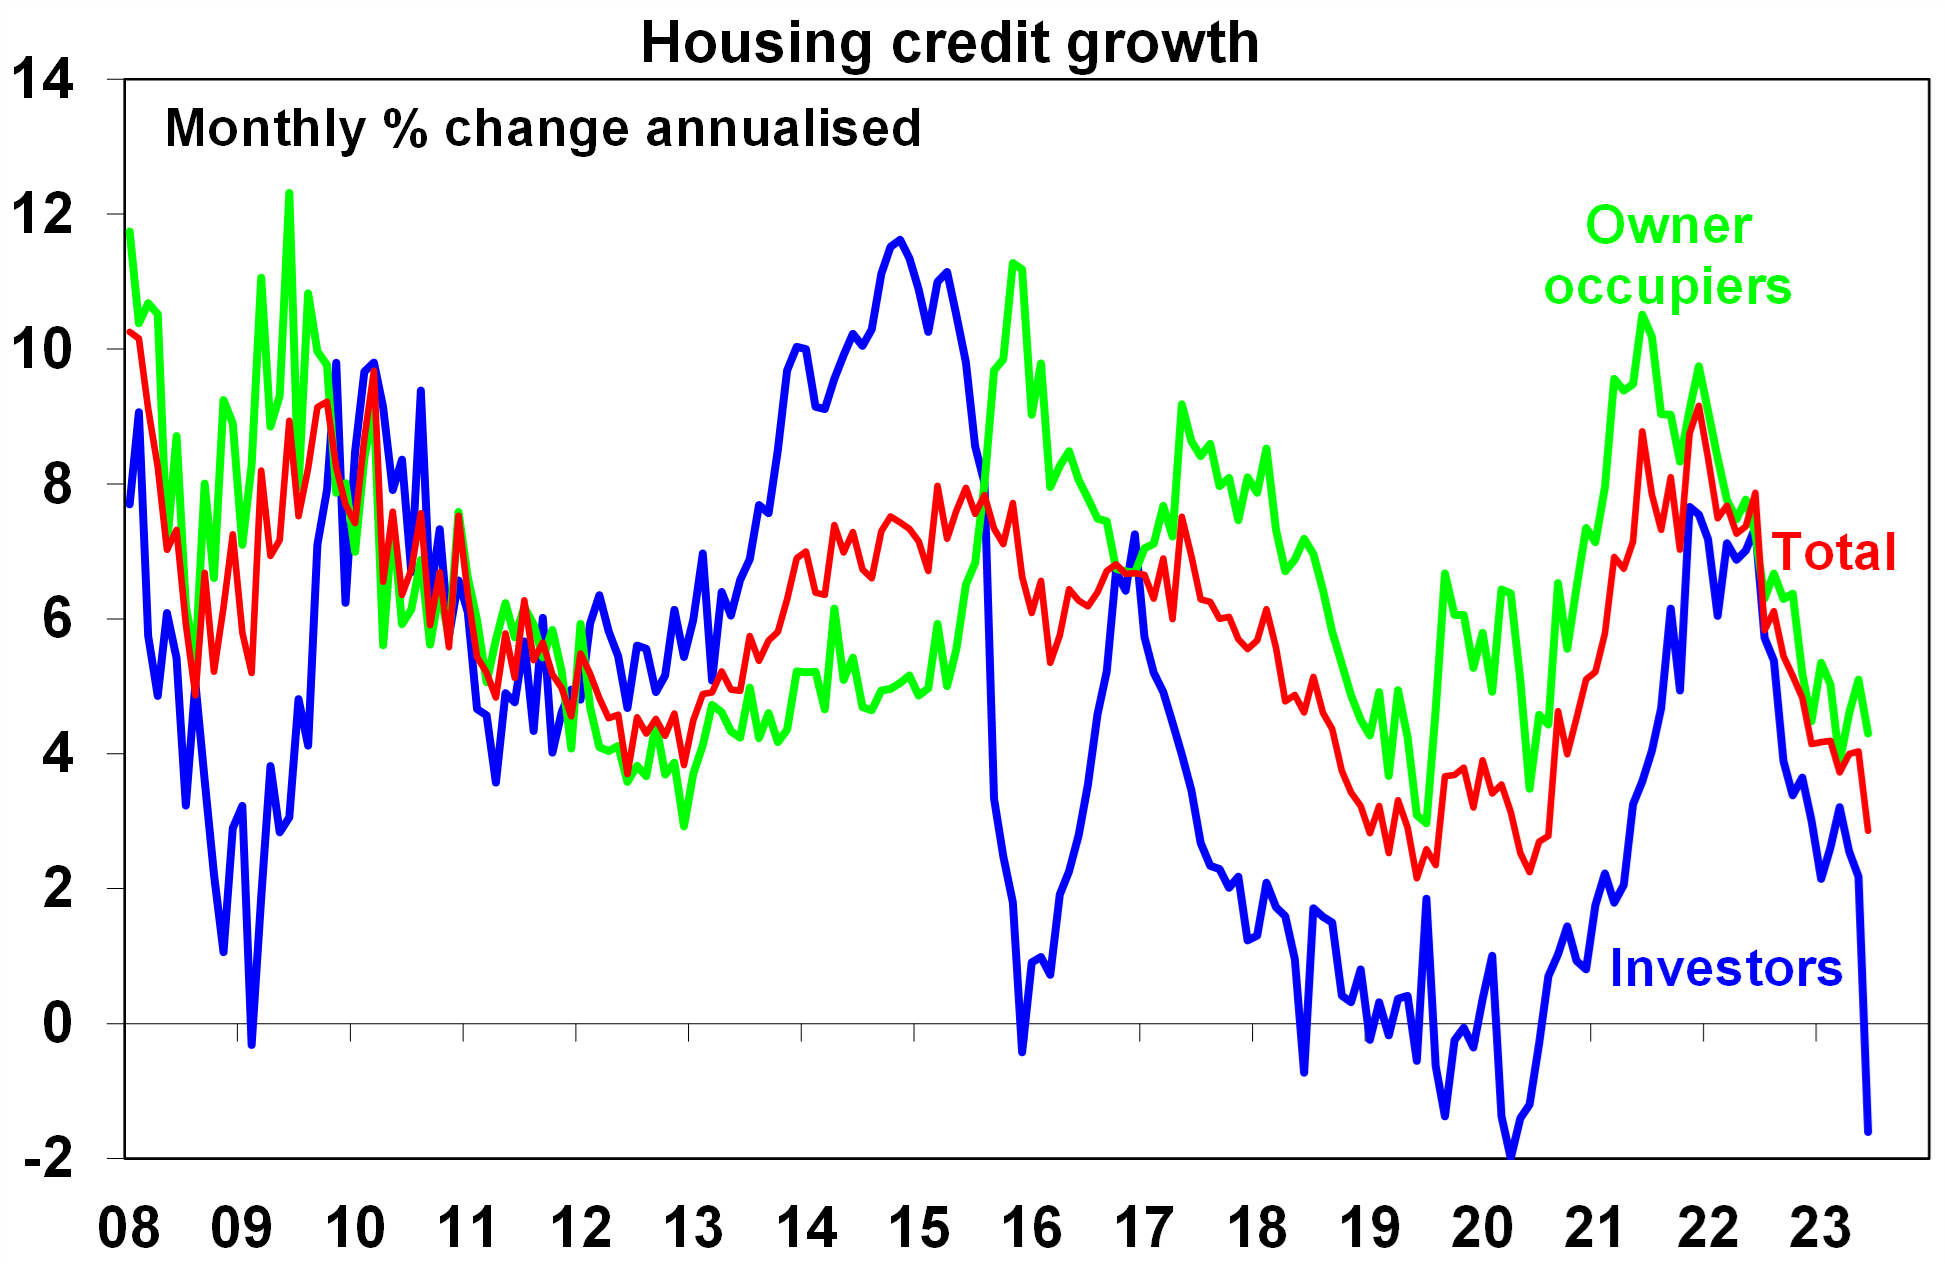
Source: RBA, AMP
- CoreLogic monthly national average home prices rose by 1.1% in June, the fourth rise in a row and are now up by 3.4% since their February low. However, the pace of monthly gains in home price is slowing which makes sense as borrowing capacity has taken a massive hit (down by around 29% since April last year). Expect to see home prices flat to slightly up for the whole of 2023 (so far prices are up by 2.2% this year).
- June quarter retail volumes fell by 0.5%, the third consecutive quarterly decline in volumes (which has only ever happened in history once before during the GFC in 2008) and volumes even fell in eating out by 0.1% (which has been the strongest part of consumer spending as part of the “revenge spending” being done by consumers). Retail volumes will detract around 0.1 percentage points from June quarter GDP growth.
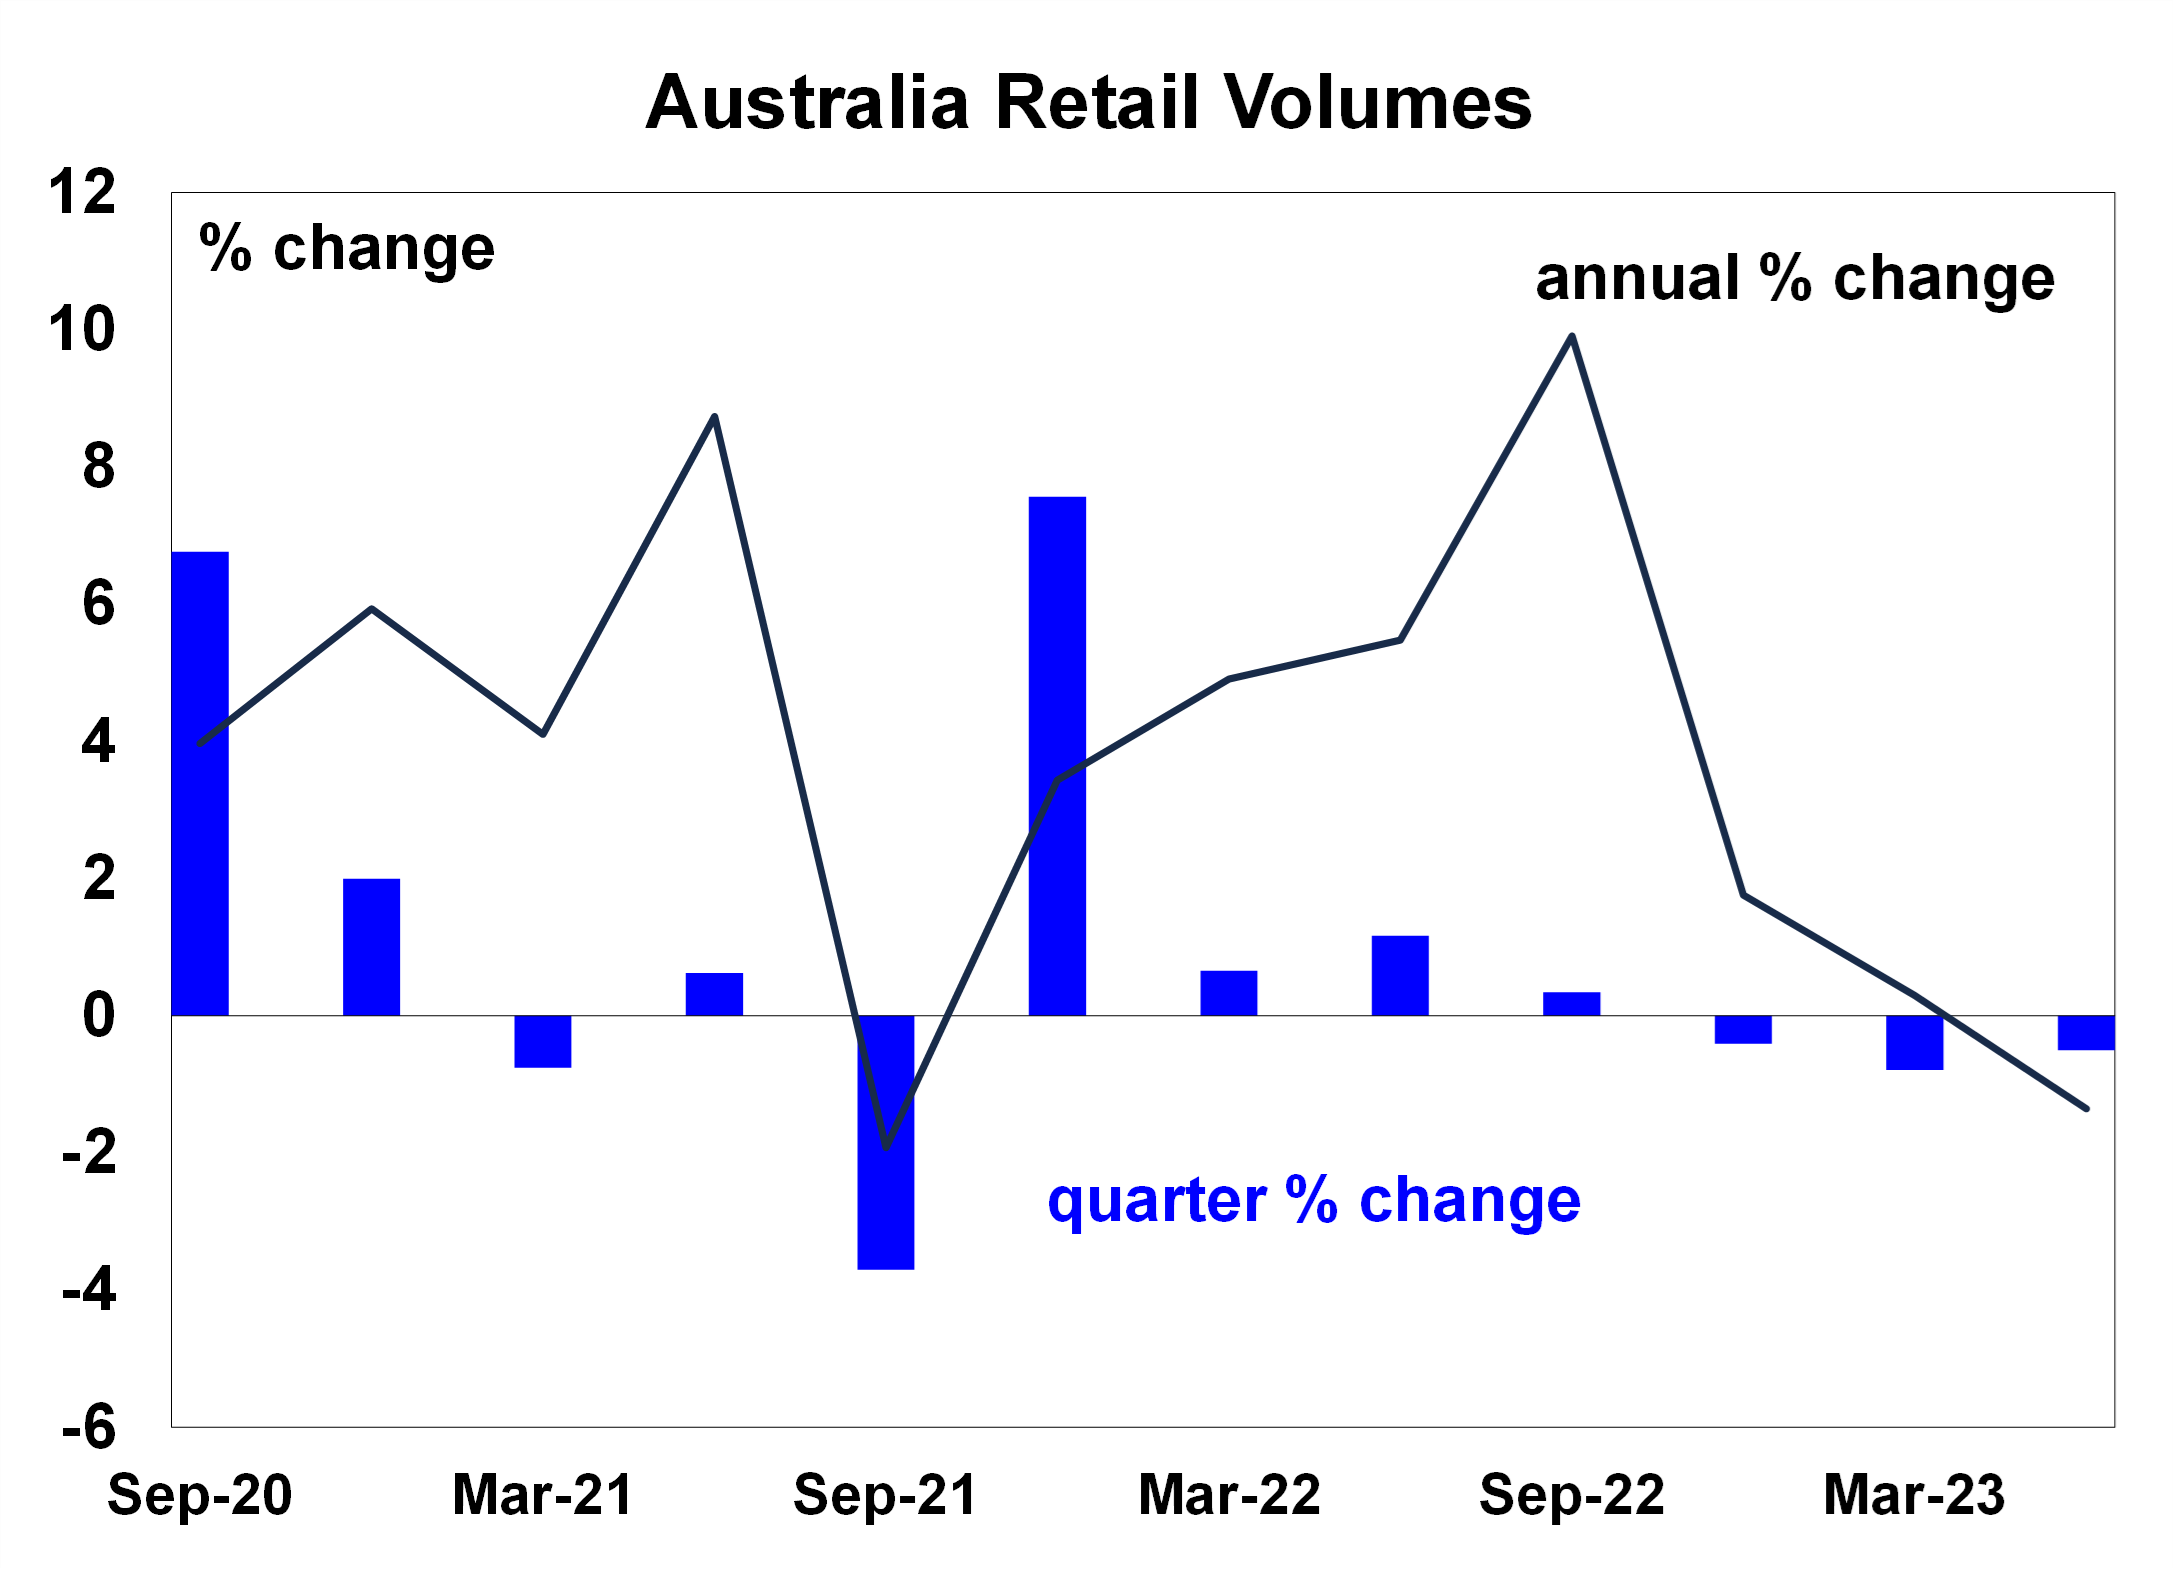
Source: Macrobond, AMP
- The June trade surplus was stronger than expected at $11.3bn. Net export volumes will contribute 0.4 percentage points to June quarter GDP.
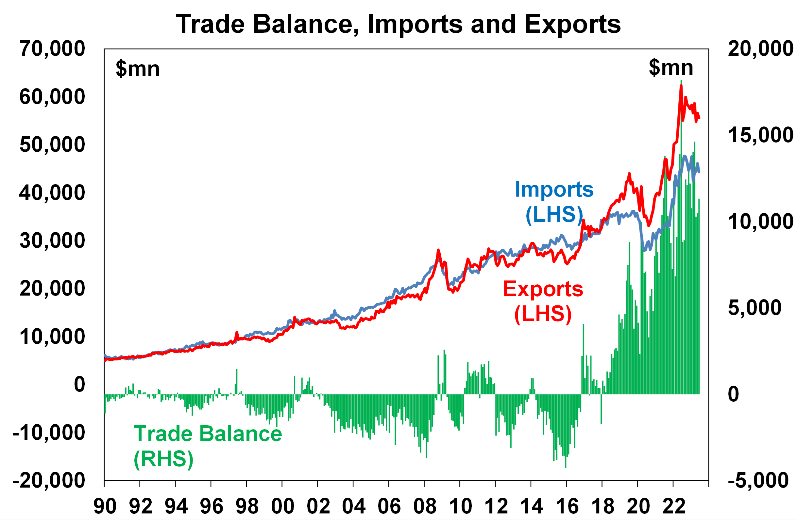
Source: Macrobond, AMP
What to watch over the next week?
- In Australia next week, there are the July ANZ job advertisements (likely to be down), August Westpac/Melbourne Institute consumer sentiment (which could see some improvement given lower inflation and unchanged interest rates) and July NAB business survey (likely to be flat/slightly down). Reporting season also gets more underway next week, with many of the banks reporting. The consensus is for a small rise in earnings growth through FY23.
- New Zealand data includes July card spending, the business manufacturing PMI and food prices.
- US non-farm payrolls are released tonight and are expected to show a slowing in the pace of jobs growth (at around +200K), a steady unemployment rate at 3.6% and a slowing in average hourly earnings. Next week’s data includes the July consumer price index, which is expected to show a small 0.2% rise over the month or 3.2% over the year with annual core inflation at 4.8%, producer prices are also expected to be up by just 0.2% over July, the University of Michigan consumer sentiment index should show some improvement, monthly budget figures are also released along with the NFIB small business confidence.
- In the Eurozone, June retail sales figures are due tonight and should show a slight increase in spending over the month.
- Chinese data includes the July trade balance (expected to show a deterioration in the surplus), July consumer prices (expected to be down by 0.5% over the year), producer prices (likely to be 4% lower over the year to July), aggregate financing (or credit growth) China, trade balance, July consumer prices.
Outlook for investment markets
- The next 12 months are likely to see a further easing in inflation pressures and central banks moving to get off the brakes. This should make for reasonable share market returns, provided any recession is mild. But the next few months could still see a correction given high recession and earnings risks, the risk of still more hikes from central banks and poor seasonality out to around September/October.
- Bonds are likely to provide returns above running yields, as growth and inflation slow and central banks become dovish.
- Unlisted commercial property and infrastructure are expected to see soft returns, reflecting the lagged impact of last year’s rise in bond yields on valuations. Commercial property returns are likely to be negative as “work from home” hits space demand as leases expire.
- With an increasing supply shortfall, the national average home price forecast for this calendar year has been revised up to around flat to up slightly ahead of 5% growth next year. However, the risk is high of a further leg down on the back of the impact of high interest rates and higher unemployment.
- Cash and bank deposits are expected to provide returns of around 4%, reflecting the back up in interest rates.
- The $A is at risk of more downside in the short term, but a rising trend is likely over the next 12 months, reflecting a downtrend in the overvalued $US and the Fed moving to cut rates.
Source: AMP ‘Weekly Market Update’