Disclaimer
Information provided on this website is general in nature and does not constitute financial advice. Every effort has been made to ensure that the information provided is accurate. Individuals must not rely on this information to make a financial or investment decision. Before making any decision, we recommend you consult a financial adviser to take into account your particular investment objectives, financial situation and individual needs.
Weekly Market Update – 21st July 2023

Investment markets and key developments
- Global shares were mixed over the last week as investors digested the strong gains of the previous week and as central bank interest rate expectations were revised up a bit in some countries. For the week US shares rose 0.7%, Eurozone shares rose 0.4%, Japanese shares lost 0.3% and Chinese shares fell 2%. Australian shares rose just 0.1% not helped by stronger than expected jobs growth pushing up RBA rate hike expectations with falls in materials and telcos offsetting gains in financials and health shares. Bond yields were mixed but mostly little changed. Oil prices rose but metal and iron or prices fell. And the $A fell as the $US rose slightly.
- Shares remain at risk of a short-term correction given high recession risks, worries about Chinese growth, the risk of more rate hikes with central banks, including the RBA, remaining wary and the seasonally rougher patch often seen through August to October. But the ongoing fall in global inflation with the promise of a peak in interest rates is consistent with our positive 12-month view on shares and appears to be dominating for now. So, any pull back may be shallow.
- The past week saw more countries report falls in inflation, following the fall in inflation to 3%yoy in the US. This is all adding to evidence that global inflationary pressures are in retreat.
-
- Canadian inflation fell to 2.8%yoy in June (from 3.4%) with the average of its underlying measures falling to 3.8%yoy (from 3.9%).
-
- NZ inflation fell to 6%yoy in the June quarter from 6.7%, with core (ex-energy & food) inflation falling to 6.1%yoy from 6.5%.
-
- UK inflation fell to 7.9%yoy from 8.7% with core inflation falling to 6.9% from 7.1%.
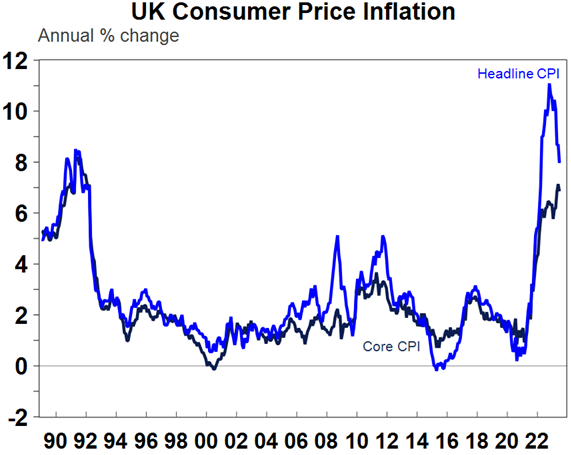
Source: Macrobond, AMP
- Sticky core inflation is a concern and keeps central banks on edge for now. This risks another 0.25% hike in Canada and New Zealand. And the Bank of England continues to face a bigger problem given the surge in its wages’ growth to 7.3%yoy so is still likely to hike at its August meeting, but probably now by 0.25% rather than 0.5%. But the UK is a special case given the inflationary shock of Brexit and its less functional Monetary Policy Committee. And in a bigger picture sense the decline in inflation is likely to continue as demand continues to cool adding to confidence that interest rates are at or near the top globally.
- RBA minutes pivot to be a bit less hawkish consistent with recent messaging from Governor Lowe, but after the strong June jobs report another rate hike still looks likely in August at this stage. The decline in global inflationary pressure is a positive for Australia too and adds to the likelihood that the RBA is at or near the top on rates. Interestingly the minutes from the last RBA board meeting leaned a bit less hawkish consistent with Governor Lowe’s softened tightening bias. The minutes reiterated that “some further tightening may be required” given risks around services inflation, wages and productivity but it suggests that the RBA may be starting to pay more attention to rising mortgage interest payments as a share of income which it notes are around a record high, the lags with which monetary policy impacts the economy and the labour market and the risk of the economy slowing more than expected and unemployment rising more than required to return inflation to target (which RBA forecasts put at around 4.5%). This highlights the balancing act the RBA is now undertaking is getting more risky and makes the next RBA board meeting a close call. We remain of the view that the RBA has already done enough and the best option is to pause for an extended period. But the RBA has also indicated it will be looking at the latest labour market, inflation, global economy and household spending data along with updated RBA forecasts at its next meeting. Given ongoing RBA concerns about high services inflation, rising wages growth and weak productivity, the strong jobs data for June with unemployment back down at 3.5% at this stage points to another 0.25% rate hike next month (which is our forecast). Governor Lowe may also want to get any further interest rate hikes out of the way ahead of Michele Bullock taking over in mid-September. But data in the week ahead for inflation and retail sales will be critical.
- Why it makes no sense to define full employment as “zero involuntary unemployment”. As part of the Government’s move to redefine the RBA’s objectives around price stability and full employment, unions are reportedly arguing that full employment should be redefined as “zero involuntary unemployment”. While well meaning, such an approach unfortunately won’t work. Put simply there are basically three types of unemployment:
-
-
frictional unemployment which occurs when a worker is in between jobs;
-
-
-
structural unemployment which results from a mismatch between workers’ skills and those required by employers; and
-
-
-
cyclical unemployment which goes up and down with the state of the economy.
-
- All unemployment may be seen as involuntary, except some frictional unemployment. Frictional unemployment is always likely to exist for obvious reasons as is structural unemployment as long as there are skill mismatches. But good macro-economic management should be able to minimise cyclical unemployment and ideally aim to keep this at zero. However, trying to push the economy faster and go beyond zero cyclical unemployment will likely just result in accelerating inflation and unsustainable wages growth. The RBA uses the so-called non-accelerating rate of unemployment (or NAIRU) which is the lowest sustainable unemployment rate that doesn’t cause wages growth and inflation to accelerate as its guide to full employment (or zero cyclical unemployment). Right now the RBA and Federal Treasury estimate that NAIRU is somewhere around 4.25%. At 3.5% unemployment currently we are therefore below estimated full employment (as defined as zero cyclical unemployment). Of course, the NAIRU estimate needs to be treated with caution, but it may be roughly right given the acceleration in wages growth that we have started to see. Asking the RBA to also push structural and frictional unemployment to zero consistent with some concept of “zero involuntary unemployment” will likely make it impossible to meet its 2-3% inflation objective and run a high risk of permanently high inflation (which the 1970s experience tells us will mean even higher interest rates, lower growth in living standards and eventually probably even higher unemployment). Rather it should be the goal of the Government to find ways to reduce structural and frictional unemployment (and hence the so-called NAIRU) by improving education and training standards, minimising skill mismatches, making it easier for workers to retrain, increasing labour mobility and increasing labour market flexibility. These are things that the RBA simply does not have the ability to do.
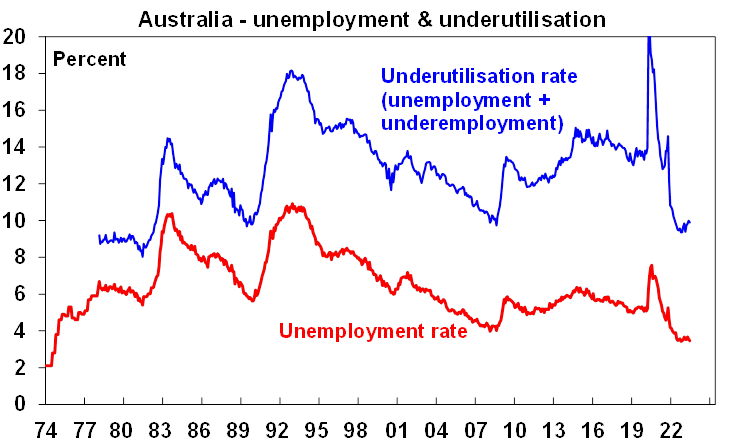
- Rather than mess around with semantics and impose impossible to meet objectives on the RBA one area worth looking at though is how underemployment and broader labour market underutilisation relate to full employment. This was a big issue in the pre-pandemic years with falling and low unemployment but high and rising underemployment with underemployment often seen as a sideshow in the setting of monetary policy.
- How big a threat is Russia’s move to end the Ukraine grain export deal? Its bad news but not as bad as the disruption early last year. Ukraine exports about 5% of global wheat, corn and barley and 20% plus of sunflower seeds & meal. Closing the Black Sea export corridor will result in more costly land and river transport and hence higher prices. After Russia ended the deal and threatened ships that may pass through the corridor wheat prices rose about 12%. However, wheat prices have since fallen back by about 4% and are still in the same range they have been in all year and are still down around 35% from their post Ukraine invasion high. Moreover, use of the corridor had ground to a virtual halt anyway limiting the actual disruption. Even if grain prices rebound further the global backdrop in other commodities and goods generally is now of falling inflation in contrast to early last year when the invasion occurred when prices for everything seemed to be accelerating.
Economic activity trackers
- The Economic Activity Trackers ticked down in Australia in the last week but rose slightly in Europe and the US. They are still yet to indicate any significant fall in economic activity though.
![]()
Levels are not really comparable across countries. Based on weekly data for eg job ads, restaurant bookings, confidence, credit & debit card transactions and hotel bookings. Source: AMP
Major global economic events and implications
- US data releases remained mixed over the last week. Retail sales in June were softer than expected but underlying growth was a bit better albeit annual growth in real and nominal terms was modest. Industrial production unexpectedly fell with capacity utilisation also down. Manufacturing conditions in the New York and Philadelphia regions were weak in July, but they are up from their lows.
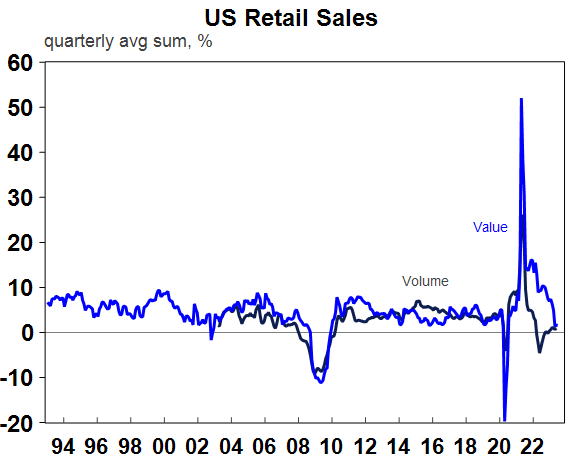
Source: Macrobond, AMP
- While US home builder conditions continue to improve, most other US housing related indicators remain weak. Mortgage applications and existing home sales have been hit by the rebound in mortgage rates, and housing starts and permits fell in June.
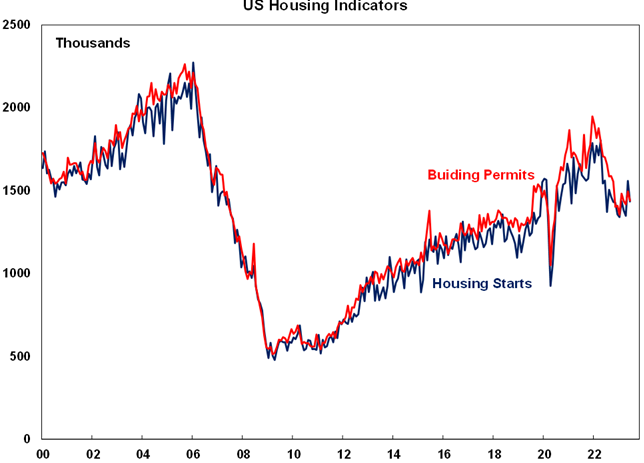
Source: Bloomberg, AMP
- The Conference Board’s US Leading Index fell further in June continuing to point to a high risk of recession.
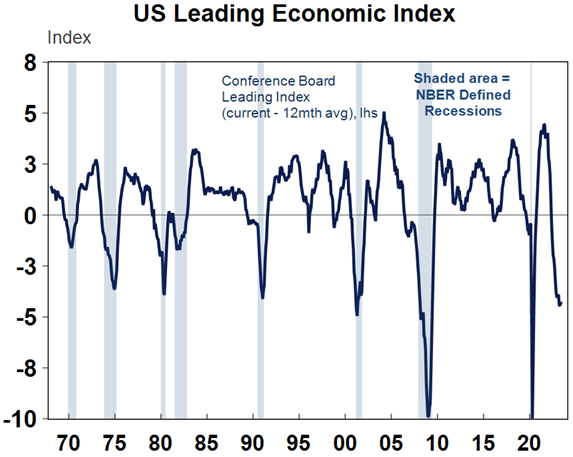
Source: Macrobond, AMP
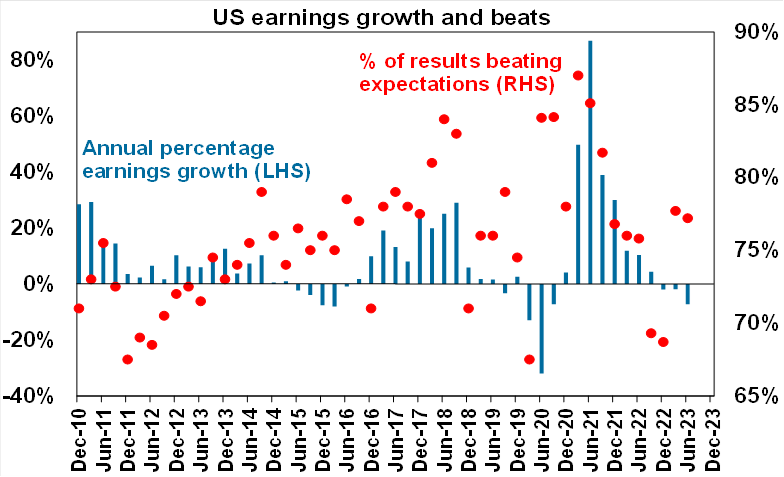
- Its early days with the US June quarter reporting season but so far so good. 17% of S&P 500 companies have reported so far with 78% beating expectations (compared to the norm of 76%) with an average beat of 7%. Consensus earnings expectations for a 7% decline in earnings over the year to the June quarter are likely to beaten by a wide margin.
Source: Bloomberg, AMP
- Japanese inflation in June unexpectedly rose to 3.3%yoy from 3.2%, but with core inflation unchanged at 2.6%. Japan’s inflation rate is increasingly looking like it can be sustained around the 2% target but it’s still a bit too early to be confident and we still need to see sustained stronger wages growth.
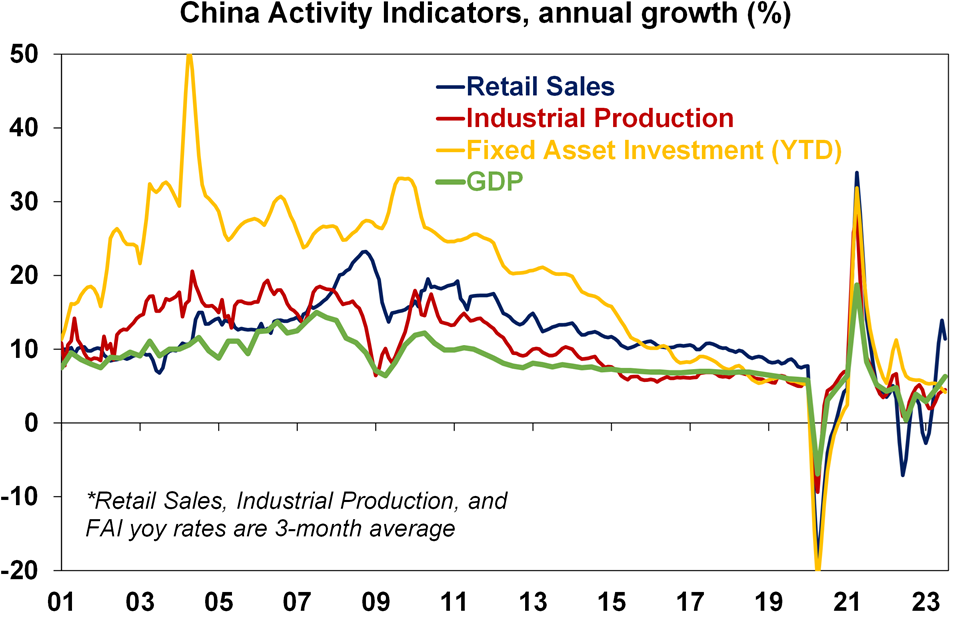
- Chinese economic data for the June quarter was a mixed bag adding to concerns about the strength of its post covid economic rebound. GDP growth slowed to 0.8%qoq with annual growth coming in weaker than expected at 6.3%yoy when the consensus was expecting a 7.1%yoy rise from the lockdown depressed activity a year ago. Growth in industrial production and investment beat expectations but retail sales slowed more than expected to just 3.1%yoy (note that the chart below is smoothed), property sales and investment were weak and youth unemployment continued to trend up beyond 20%. Further stimulus is likely and has been promised but so far it has disappointed.
Source: Bloomberg, AMP
Australian economic events and implications
- Another strong jobs report in Australia adding to the likelihood of another RBA rate hike. The June jobs data was unambiguously strong with employment up by 32,600 all driven by full time jobs (against economists’ expectations for a 15,000 gain), unemployment back down to 3.5% (and just above its low late last year of 3.4%), underemployment unchanged at a near multi-decade low, hours worked continuing to rise solidly and a record high level of the 15 plus population in employment. This is likely all a bit stronger than the RBA was expecting and as the labour market is something it watches closely adds to the likelihood of another rate hike in August. Of course data for inflation, retail sales in the week ahead and the RBA’s revised forecasts will also impact what the RBA does at its August meeting.
Source: ABS, AMP
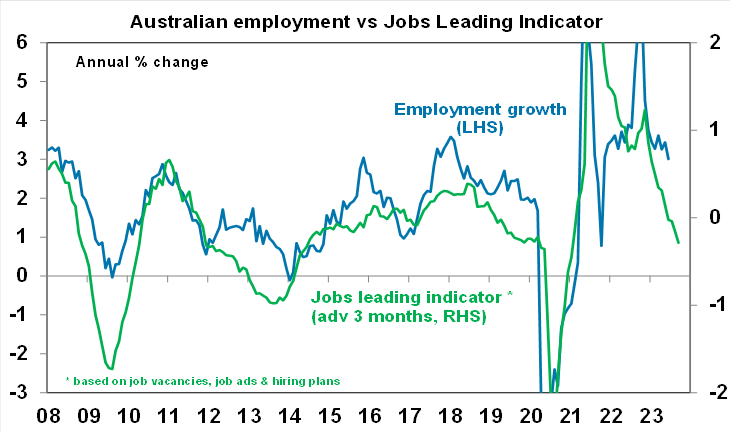
- Just recall though that the labour market is a lagging indicator – unemployment was one of the last indicators to turn sour going into the early 1990s recession. Our leading indicator of jobs growth continues to deteriorate (first chart below) and data from Seek shows a rising trend in applications per job ad (second chart). Consumer surveys also show a rising trend in unemployment expectations which has tended to lead the unemployment rate at turning points. This would suggest that it’s only a matter of time before official jobs data starts to deteriorate. So given the massive increase in rates that has already occurred and that its lagged impact is yet to fully show up, the RBA really needs to tread carefully from here lest it end up pushing unemployment far higher than it needs too in order to return inflation to target.
Source: ABS, AMP
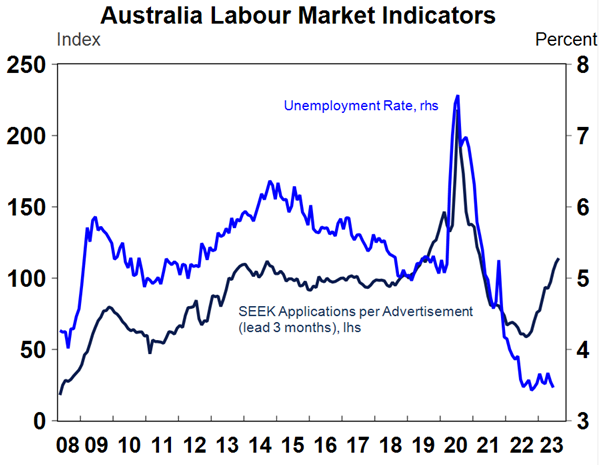
Source: Macrobond, Seek, ABS, AMP
- In other data, the Westpac/Melbourne Institute Leading Index ticked up slightly in June but still points a sharp downturn in economic growth and the HIA’s survey of new home sales showed a 4.8% fall in June leaving them around ultra-low levels.
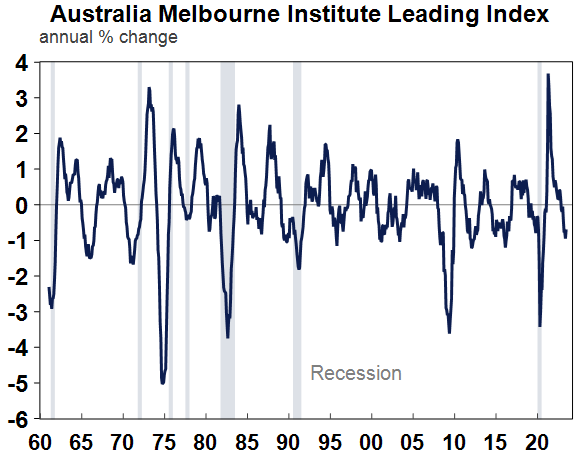
Source: Macrobond, Westpac/MI, AMP
What to watch over the next week?
- July business conditions PMIs for the US, Europe, Japan and Australia will be released on Monday and will be watched for further moderation after the rise in most countries earlier this year.
- In the US the focus will be on the Fed (Wednesday) which is expected to raise the Fed Funds rate by another 0.25% taking it to 5.25-5.5%, but signal only a weak bias to raise rates further which will be dependent on economic activity and inflation data. On the data front expect to see increased home prices and consumer confidence (Tuesday), a 1.8% annualised gain in June quarter GDP and a modest rise in durable goods orders (Thursday) and a further slowing in June quarter growth in employment costs to 1.1%qoq and a slowing in June core personal consumption deflator inflation to 4.2%yoy from 4.6% in May (Friday). The US June quarter profit reporting season will ramp up further with results from Alphabet, Exxon and Meta amongst many others.
- The ECB (Thursday) is also expected to raise its policy rates by another 0.25% taking its deposit rate to 3.75% and its main refinancing rate (equivalent to Australia’s cash rate) to 4.25%, but while still hawkish it will likely open the possibility of a pause in September depending on how economic data unfolds. Eurozone economic confidence data will be released Friday.
- The Bank of Japan (Friday) is not expected to make any changes to its ultra easy monetary policy, excepting that while Governor Ueda recently appeared to play down chances of a shift (not that he would tell us in advance anyway) there is a possibility that it will widen the tolerable band around its 0% 10-year bond yield target to +/- 100basis points. A change to yield curve control is more likely later this year though. The BoJ is also likely to revise up its inflation forecasts for this year.
- In Australia, inflation is likely to show a further fall in the June quarter with quarterly CPI inflation falling to 1%qoq or 6.2%yoy from 7%yoy in the March quarter. This would be the slowest quarterly increase since the September quarter 2021. Food, rent and financial services are likely to see solid increases with clothing & health prices seeing a seasonal bounce but fuel prices are likely to be flat with holiday travel down along with education for seasonal reasons. Trimmed mean inflation is expected to have fallen to 1%qoq or 5.9%yoy. If correct inflation will be slightly below RBA forecasts for 6.3%yoy for the CPI and 6%yoy for the trimmed mean so on its own it won’t be enough to trigger another RBA rate hike. The ABS’ Monthly Inflation Indicator for June is expected to have fallen further to 5.4%yoy. June quarter producer price inflation (Friday) is also likely to have slowed further from 5.2%yoy in the March quarter and June retail sales (also Friday) are expected to be roughly flat.
Outlook for investment markets
- The next 12 months are likely to see a further easing in inflation pressures and central banks moving to get off the brakes. This should make for reasonable share market returns, provided any recession is mild. But the next few months could still see a correction given high recession and earnings risks, still somewhat hawkish central banks and poor seasonality out to around September/October.
- Bonds are likely to provide returns above running yields, as growth and inflation slow and central banks become dovish.
- Unlisted commercial property and infrastructure are expected to see soft returns, reflecting the lagged impact of last year’s rise in bond yields on valuations. Commercial property returns are likely to be negative as “work from home” hits space demand as leases expire.
- With an increasing supply shortfall, we revised up our national average home price forecast for this calendar year to around flat to up slightly ahead of 5% growth next year. However, the risk is high of a further leg down putting us back on track for a 15-20% top to bottom fall on the back of the impact of high and still rising interest rates and higher unemployment.
- Cash and bank deposits are expected to provide returns of around 4%, reflecting the back up in interest rates.
The $A is at risk of more downside in the short term, but a rising trend is likely over the next 12 months, reflecting a downtrend in the overvalued $US and the Fed moving to cut rates.
Source: AMP ‘Weekly Market Update’