Disclaimer

Information provided on this website is general in nature and does not constitute financial advice. Every effort has been made to ensure that the information provided is accurate. Individuals must not rely on this information to make a financial or investment decision. Before making any decision, we recommend you consult a financial adviser to take into account your particular investment objectives, financial situation and individual needs.

Weekly Market Update – 7th January 2022

Weekly Market Update

Investment markets and key developments over the past week

  • The economic calendar was fairly quiet in the first week of the new year, but fears of rising US interest rates led to some sharemarket wobbles. US sharemarkets were down 1.5%, with large falls in tech, real estate, healthcare and communication sectors. Rising 10-year bond yields (up by 20 basis points since last week to 1.7%) were negative for tech stocks (with the tech-heavy NASDAQ down 3.6% over the week). Tech shares tend to underperform when long-dated bond yields rise. The ASX fell significantly on Thursday, taking its lead from the US, but managed a turnaround on Friday and was up by 0.4% over the week at the time of writing. European shares managed to squeeze out a gain of 0.6%, Japanese shares were down by 1.1% and Chinese shares fell by 2.5%. The $US rose and the $A was down to 0.71USD. Oil and natural gas prices rose while metals prices were mixed.
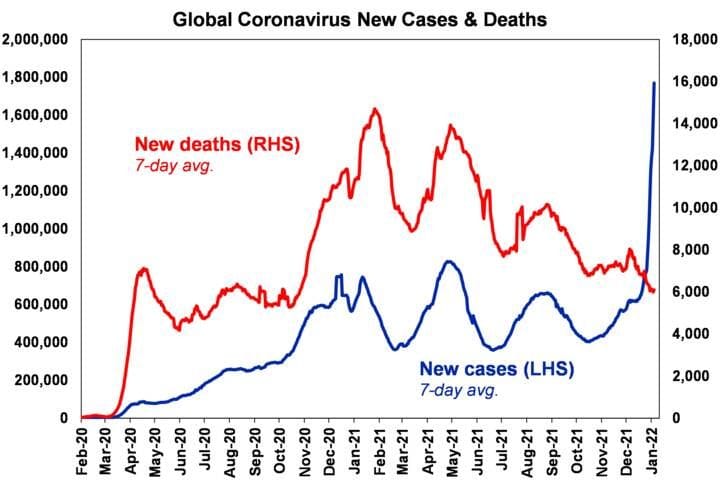
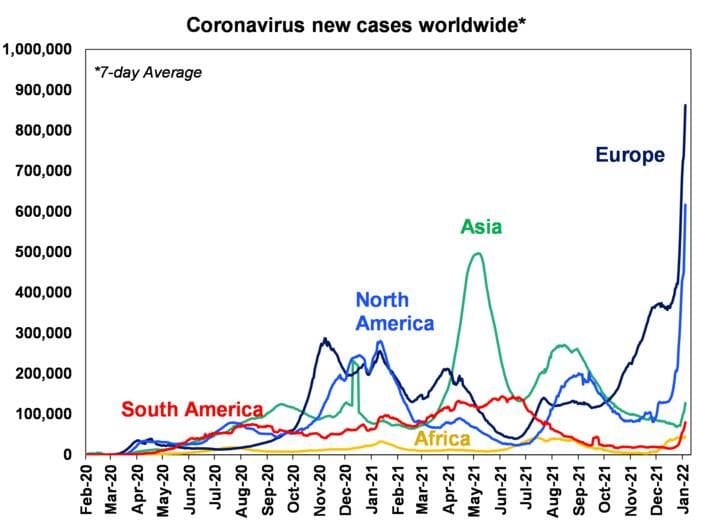
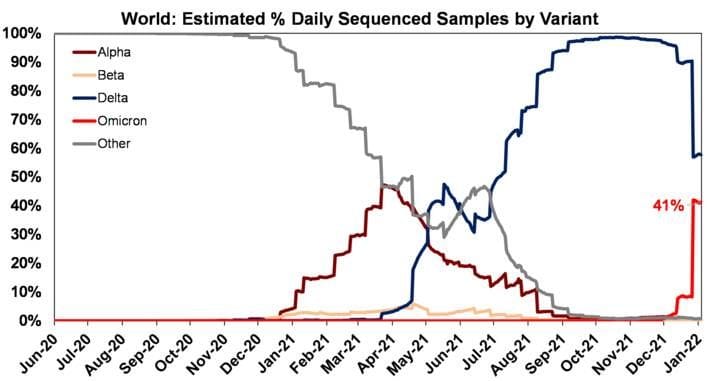
  • Global coronavirus cases have skyrocketed over recent weeks across European countries, the US, Canada and Australia (see the charts below) with new cases more than double levels from the previous peak, with the more transmissible but less deadly Omicron variant making up the largest share of new Covid-19 cases around the world. Coronavirus continues to impact economic activity, despite less severe lockdowns, lower deaths and the availability of vaccines, so it is still important to keep an eye on cases and hospitalisations.

Source: ourworldindata.org, AMP Australia

Source: ourworldindata.org, AMP Australia

Source: ourworldindata.org, AMP Australia

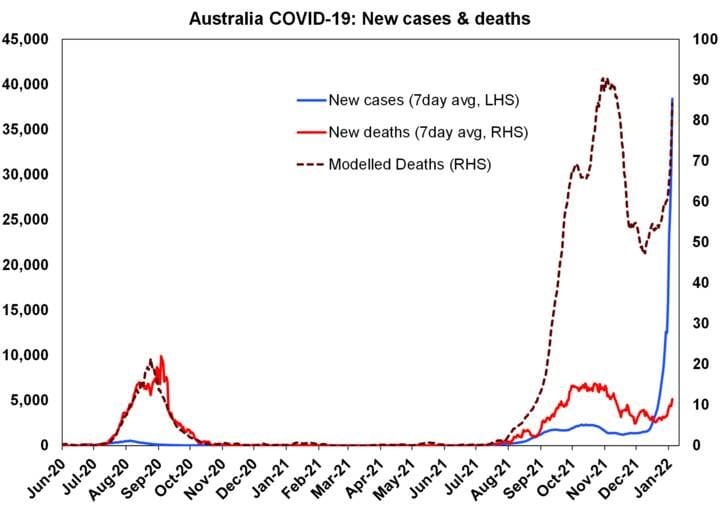
  • The good news is that Omicron does appear less deadly (which probably also has something to do with the population being protected by vaccines and prior exposure to the virus over the past two years) and while new deaths do tend to lag new cases by a few weeks (so are still likely to rise over coming weeks), they are well below deaths recorded earlier in 2021.
  • Australian modelled deaths are running at around 13% of predicted deaths based on the Delta wave (see the chart below).

Source: ourworldindata.org, AMP Australia

  • And most of those needing hospitalisation remain the unvaccinated (see the chart below) which is more proof that vaccines work to prevent serious illness.

Source: NSW Health, AMP Australia

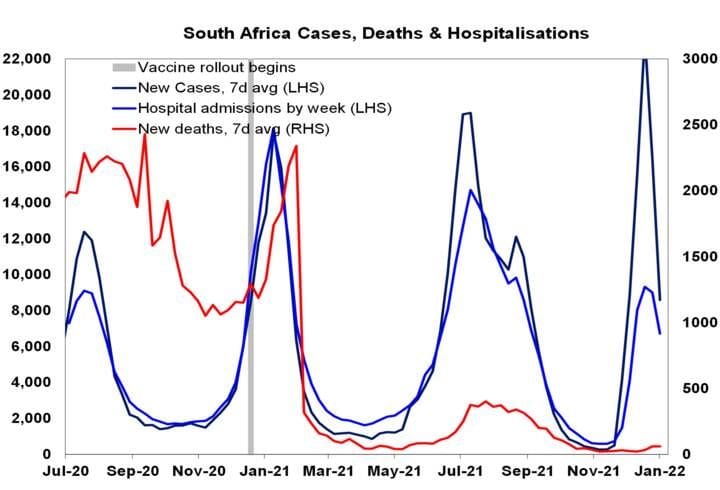
  • Out of interest, in South Africa new Covid-19 cases spiked in mid-December but have since started to decline which has given some hope that Omicron will eventually see Covid-19 turn out to be a less severe disease. Although it’s probably also related to some restrictions imposed by the government in response to the outbreak of Omicron.

Source: ourworldindata.org, AMP Australia

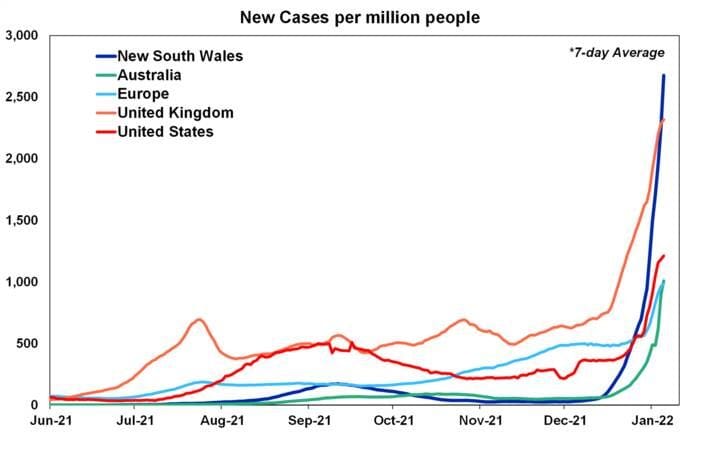
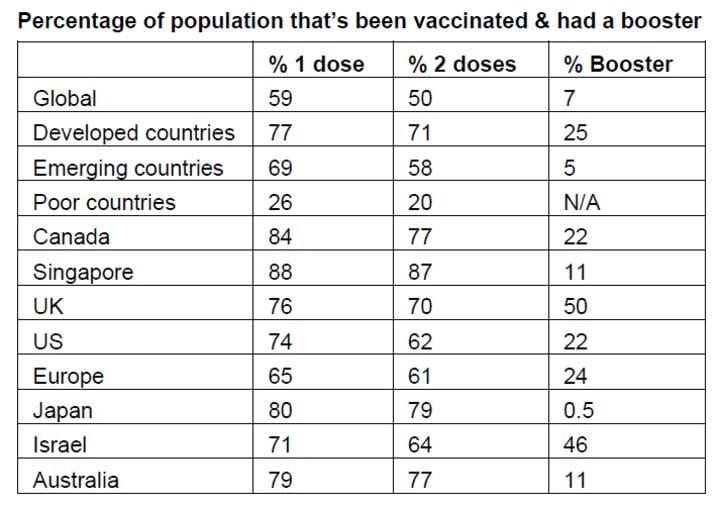
  • Australia is in a bad position with the spread of coronavirus with NSW and Vic recording new daily record highs in cases. This boils down to the easing of virtually all restrictions in December at a time of a new, more transmissible variant, very early stages of the booster rollout (see the table below of booster rollout comparisons around the world, Australia has given 11% of its population a booster vs the UK at 50%) and the holiday season which means more travel and interactions. NSW cases per capita are currently higher than the US and UK on a 7-day average (see chart below). And of course the difficulty in getting a PCR test means that many cases are going uncounted with people relying on rapid antigen tests (if you are lucky enough to get one… hopefully this situation resolves itself in a few weeks once supply is higher).

Source: ourworldindata.org, AMP Australia

Source: ourworldindata.org, AMP Australia

  • While we need to live with Covid-19 in our daily lives, the easing of restrictions in NSW and Vic could have been done in a safer and slower way, to allow the system to cope with higher cases while also supporting economic activity. And while lockdowns hit economic activity, a high case load does the same thing. People will choose to self-regulate mobility and live lockdown “light” and businesses will get disrupted by sick or isolating staff which is already becoming clear in the fall of the economic activity indicator. Previously was expecting March quarter GDP to increase by 1.6% but given the high case count it has been revised down to a smaller increase of around 0.6%. Of course this could mean that GDP growth will rebound again in the June quarter, if coronavirus cases decline.
  • Now, it is likely that more restrictions will have to be imposed in NSW to slow down case growth and allow the hospital and testing system to cope with higher cases. While the state government assures us that hospital capacity is still manageable, the cancellation of elective surgeries tells a different story. Today’s media is reporting that some restrictions are going to be announced soon, like nightclub closures and stopping singing and dancing in pubs.
  • Our economic activity trackers moved lower this week (see the chart below) across Europe, Australia and the US as coronavirus cases continued to rise. In Australia, consumer confidence weakened, restaurant bookings fell and mobility worsened. In the US, mobility fell a lot, hotel bookings were down, mortgage applications declined and job advertisements growth was also weaker. The fall in the Europe tracker was mainly because of lower restaurant bookings and retail traffic.

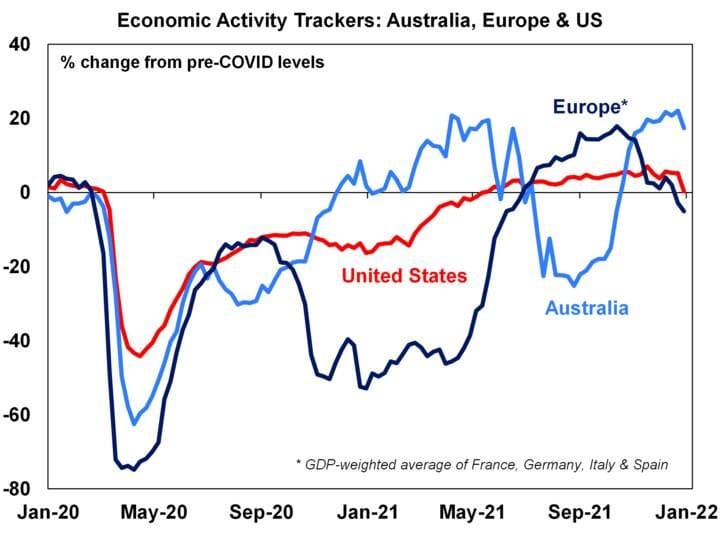
Based on weekly data for eg job ads, restaurant bookings, confidence, mobility, credit & debit card transactions, retail foot traffic, hotel bookings. Source: AMP Australia

Major global economic events and implications

  • The US Federal Reserve December meeting minutes were more hawkish than expected and confirmed the view that that interest rate hikes are likely to start sooner than expected and that reducing the size of the balance sheet (quantitative tightening) once rate hikes start is also appropriate (this means to allow the treasuries and mortgage backed securities to reach maturity and not reinvest the proceeds) which shrinks the size of the balance sheet. The US Fed balance sheet has nearly doubled since the start of the pandemic – it is currently worth 37.7% of GDP versus 19% before the pandemic. A stronger economic outlook, higher inflation and a larger balance sheet allows for faster policy rate normalisation. A start to quantitative tightening at a similar time to rate hikes also mitigates the risk of a flattening in the yield curve. The US Fed needs to tread carefully in removing policy accommodation – it should not happen too fast otherwise it risks a disruption to the rebound in economic growth and could lead to another “taper tantrum”. Previously had expected the first Fed rate hike to occur in June, but the risk is a March rate hike instead because of high inflation.
  • US November construction spending rose by 0.4%, close to expectations. Manufacturing activity is still expanding, with the December manufacturing ISM index was still strong at 58.7 (although down from last month). Job openings remain high as a share of total employment and are above the unemployment rate which means that there is a good availability of labour. The unemployment rate should continue to decline over coming months. The December ISM services index faltered to 62 (from 69.1 in the prior month) which means a slower expansion in the services sector – not surprising given high coronavirus cases.

Source: BLS, AMP Capital

  • In Europe, November producer prices were up modestly by 1.5%, although annual growth is very high at 23.2%.
  • In China, The Caixin (small business) PMI lifted in December to 53.1 from 51.7 in the prior month, indicating expanding economic activity.

Australian economic events and implications

  • Australian home prices according to CoreLogic rose by 0.6% in December bringing the 2021 increase in home prices to a stunning 21%, the strongest year since 1988. But there is a clear slowing in Sydney and Melbourne property with Sydney price growth slowing to 0.3% and Melbourne declining by 0.1%. Brisbane and Adelaide are doing well across the major capital cities and regional property was also up a solid 2.2% in December. Australian ANZ job advertisements fell by 5.5% in December but this was after two months of solid gains.

What to watch over the next week?

  • In Australia, Melbourne Institute December inflation data (due 10 Jan) is a good monthly guide to CPI and is currently tracking at 3.1% over the year. Building approvals (10 Jan) for November should show a rebound by 4% after two months of decent declines. The November trade surplus (11 Jan) is likely to expand to around $13bn. November retail spending (11 Jan) should show another large gain (around 5%) in retail sales, job vacancies (12 Jan) are likely to rise over the three months to November and housing lending data for November (14 Jan) is expected to show an increase in lending by 2%.
  • US non-farm payrolls for December are expected to rise by over 400K (after the disappointing 210K last month) and the unemployment rate is likely to decline further to 4.1% (from 4.2% last month). The NFIB small business survey is likely to remain around average with businesses impacted by supply shortages and rising wage costs. December consumer prices are expected to be 5.4% higher than a year ago in the core measure (which excludes volatile items), its highest level since the early 1980’s which will create more concern about an inflation breakout. December retail sales are likely to be flat, after a disappointing November outcome as well and the University of Michigan consumer confidence reading is expected to remain around its pandemic lows.
  • In Europe, November retail sales (due 7 Jan) are likely to fall as European countries were struggling with rising Covid-19 cases, as the economic activity indictor suggested as some countries reintroduced some restrictions. The December consumer price index is expected to rise by 0.3%, with annual growth a modest 2.5%.
  • In China, December producer and consumer prices are released and are likely to show strong producer price growth but modest consumer price inflation (around 1.7%). The trade surplus is expected to expand in December to around $73USbn.

Outlook for investment markets

  • Global shares are expected to return around 8% in 2022 but expect to see the long-awaited rotation away from growth & tech heavy US shares to more cyclical markets in Europe, Japan & emerging countries. Inflation, the start of Fed rate hikes, the US mid-term elections & China/Russia/Iran tensions are likely to result in a more volatile ride than 2021. Mid-term election years normally see below average returns in US shares and since 1950, have seen an average top-to-bottom drawdown of 17%, usually followed by a stronger rebound.
  • Australian shares are likely to outperform (at last) this year helped by stronger economic growth than in other developed countries, leverage to the global cyclical recovery and as investors continue to search for yield in the face of near zero deposit rates but a grossed-up dividend yield of around 5%. Expect the ASX 200 to end 2021 around 7,800.
  • Still very low yields & a capital loss from a rise in yields are likely to again result in negative returns from bonds.
  • Unlisted commercial property may see some weakness in retail and office returns, but industrial is likely to be strong. Unlisted infrastructure is expected to see solid returns.
  • Australian home price gains are likely to slow with prices falling later in the year as poor affordability, rising fixed rates, higher interest rate serviceability buffers, reduced home buyer incentives and rising listings impact.
  • Cash and bank deposits are likely to provide very poor returns, given the ultra-low cash rate of just 0.1%.
  • Although the $A could fall further in response to coronavirus and Fed tightening, a rising trend is likely over the next 12 months helped by still strong commodity prices and a decline in the $US, probably taking it to around $US0.80.
Source: AMP CAPITAL ‘Weekly Market Update’

AMP Capital Investors Limited and AMP Capital Funds Management Limited Disclaimer

FinSec Partners Disclaimer

Published On: January 7th, 2022Categories: Market Update