- Global shares were mixed over the last week. US shares fell by 1.7% and European shares lost 0.8% on concerns about the growth outlook and central banks reducing stimulus, but Japanese shares rose 4.3% on hopes for more fiscal stimulus after Prime Minister Suga announced he would step down and Chinese shares rose 3.5%. Australian shares fell by 1.5% on the back of the weak global lead, lower iron ore prices and concerns about the lockdowns. Bond yields rose slightly in the US, were flat in Australia but fell in Germany. Oil and metal prices rose but the iron ore price fell. The A$ fell as the US$ rose.
- The curse of September? While shares have been remarkably strong since their March 2020 lows, it’s interesting to note that US and Australian shares both had falls last September. Over the last 35 years, September has averaged to be the weakest month of the year for both share markets. There are a bunch of risks for the next month or so, with: threats from coronavirus – notably around the reopening in Australia; central banks slowing stimulus; the US debt ceiling; the passage of Biden’s remaining stimulus and tax hikes; and global supply constraints and inflation. These could all add to current fears that growth has peaked resulting in a correction. Key to watch technically will be whether the US share market continues to find support around its 50-day moving average. However, the likely continuation of the economic recovery beyond near term interruptions, vaccines ultimately allowing a more sustained reopening and tight monetary policy being a long way off augurs well for shares over the next 12 months.

Source: Bloomberg, AMP Capital
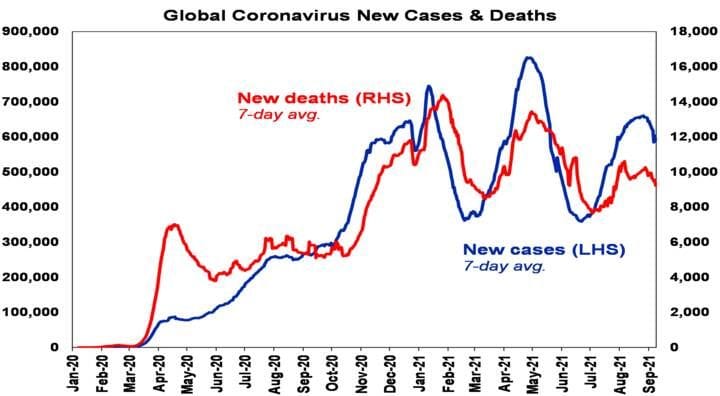
- New global coronavirus cases have now clearly rolled over again, with Asia continuing to decline, South America remaining in a downtrend and Europe and the US stabilising. New Zealand with a sharp decline in new cases also appears to be showing, along with China, that its possible to bring Delta outbreaks under control with lockdowns (albeit its lockdown has been much tighter than that in NSW).
Source: Bloomberg, AMP Capital
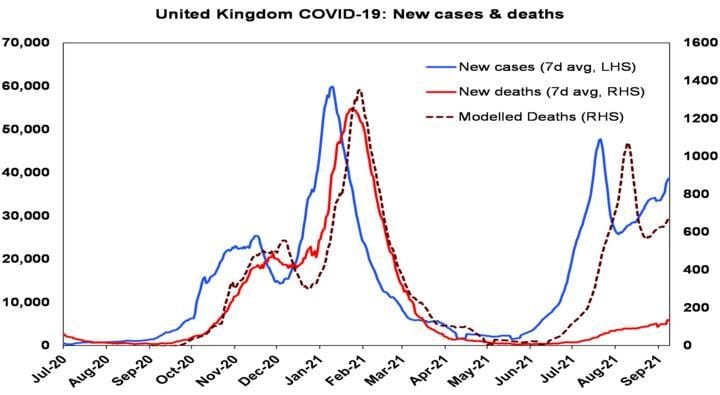
- New cases have increased in the UK and Canada, but are stable in Europe (after rising since July). However, hospitalisations and deaths remain relatively low compared to previous waves in the UK, Europe and Canada – consistent with vaccines being only 60-80% effective in preventing infection but highly effective (at around 90%) in preventing serious illness. For example, deaths in the UK (the red line in the next chart) are running well below the level predicted on the basis of the previous wave (dashed line). Given the experience with Israel that saw declining vaccine efficacy after about six months, combined with 30% to 45% still being unvaccinated, the main risk in Europe, the UK and North America may come in winter, unless booster shots are sped up for those who were vaccinated earlier this year. Australia will also likely start needing booster shots by year end.
Source: ourworldindata.org, AMP Capital
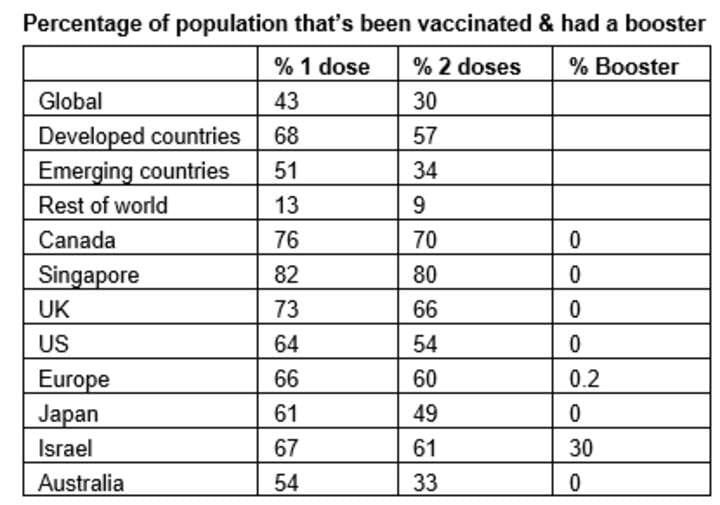
- Vaccinations are continuing to ramp up globally – but the low level of vaccinations in less developed countries is a concern. 43% of people globally and 68% in developed countries have now had at least one dose of vaccine. But its only 13% in less developed countries.
Source: ourworldindata.org, AMP Capital
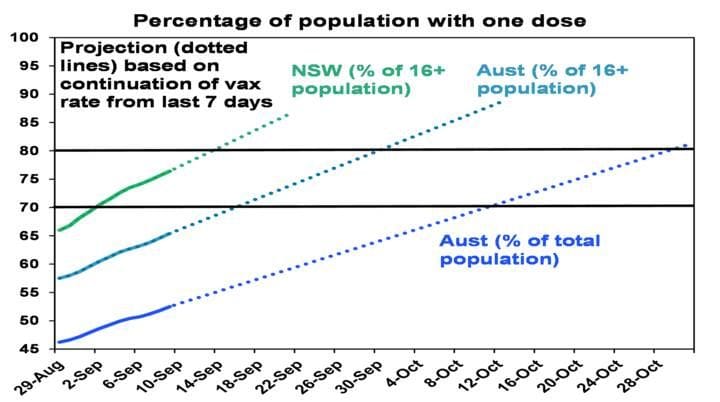
- Australia now has around 54% of its whole population with one dose. The past week has seen the pace of vaccination slow slightly to 1.84 million people a week from 1.95 million just over a week ago. This may reflect Australia reaching vaccination levels that saw the pace slow in the UK and US. But it’s more likely reflective of supply which is expected to pick up again into month end, which combined with confirmation that only the fully vaccinated will participate in NSW’s reopening next month, will likely see the pace of vaccination pick up again. The next chart shows a projection of when NSW and Australia will meet vaccination targets for one dose based on an extrapolation of the average daily vaccination rates seen in the last 7 days. To this can be added the average lag between 1st and 2nd doses to get a rough idea when the double vaccination targets will be met. This is now running at 45 days or 6.5 weeks in Australia.
Source: covid19data.com.au, AMP Capital
- On the basis of this projection, the following table shows roughly when key double dose vaccination target dates will be met. However, with the lag between doses declining (NSW has now fallen to 37 days) the targets could be met sooner. Victoria is running around 15 days behind NSW in terms of when it will meet its vaccination targets.
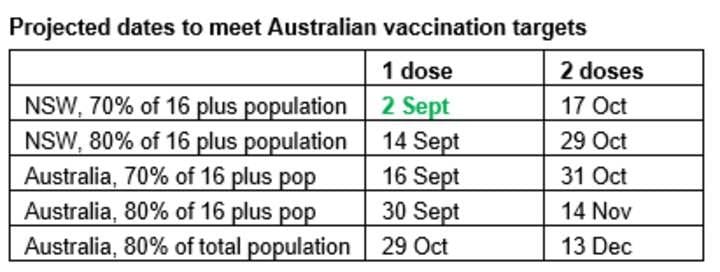
- So on this basis NSW is on track to start reopening in the second half of October and Australia is on track to follow in the first half of November. Consistent with this, NSW has announced a reopening roadmap that allows the fully vaccinated to enjoy greater freedoms in terms of gathering, restaurants, shops, hairdressing, gyms, theatres, trips in NSW etc, providing distancing requirements are met, from the first Monday after the 70% fully vaccinated target is met.
- As we have noted in previous Weekly Market Updates, because of the greater transmissibility of the Delta variant, indications that the vaccines only provide 60 to 80% protection against infection, and the reality that the national objective of 80% of adults will still leave 36% of the population unvaccinated and at risk, there is a strong argument to aim for a higher vaccination rate of 80% or more of the whole population, which Singapore has reached. Vaccine hesitancy amongst 10% or so of adults may make this difficult to achieve, but the combination of vaccinating 12 to 15 year-olds and the requirement that only the vaccinated will participate in the initial reopening (as already declared by NSW) may make this achievable.
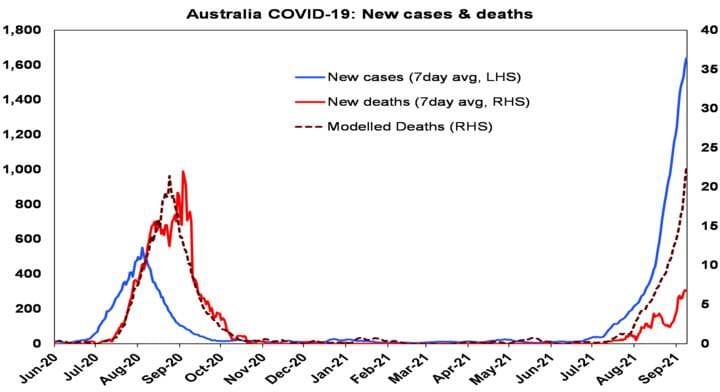
- Meanwhile, the vaccination of older people appears to be continuing to help keep the level of hospitalisations and deaths more subdued in this wave than was the case in the Victorian wave last year. Deaths (the red line in the next chart) are running around one third of the level predicted on the basis of the previous wave (dashed line).
Source: ourworldindata.org, covid19data.com.au, AMP Capital
- Our US and European Economic Activity Trackers have held up despite recent Delta outbreaks reflecting the absence of lockdowns as vaccines have helped keep hospitalisations and deaths down. In fact our European Tracker moved higher again over the last week.
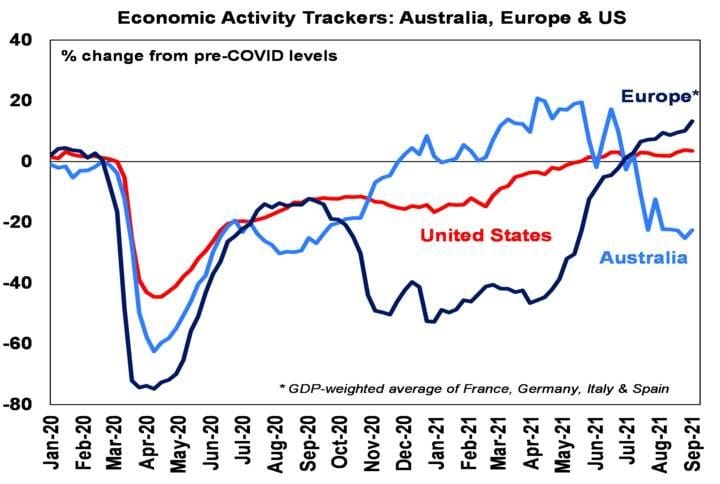
Based on weekly data for eg job ads, restaurant bookings, confidence, mobility, credit & debt card transactions, retail foot traffic, hotel bookings. Source: AMP Capital
- While our Australian Economic Activity Tracker is well down from its June high, it saw a small rise in the past week. After its plunge, it’s probably now hit bottom, as NSW and Victoria are about as low as they are going to go – providing other states manage to avoid long hard lockdowns.
- NSW is showing the path to recovery – but it’s likely to initially be more constrained and riskier than the recovery after last year’s national lockdown, which occurred against a backdrop of very low cases. Rough estimates of the cost in terms of lost economic activity from the lockdowns since May is now at $29bn, assuming they continue to the end of September and around $35bn if Greater Sydney continues to around 17th October and Melbourne to the end of October. However, when comparing to last year’s national lockdown there are some favourable factors: the lockdowns have only covered around half of the national population; Australian households and businesses seem to have found more ways to better handle lockdowns compared to 18 months ago; consumer confidence and job ads are holding up far better than seen last year; this may suggest that the more targeted government assistance may be working better this time around and that the hope offered by the vaccines is helping support confidence, in contrast to last year; and this is likely to be reinforced by NSW’s reopening roadmap, which suggests it will at least start to see some recovery in the December quarter.
- There are however some negatives: the NSW and now Victorian lockdowns look like extending into next quarter; JobKeeper is not protecting jobs like it did a year ago, risking sharper headline job losses in impacted states; reopening may be more gradual than seen after the national lockdown, being limited to the fully vaccinated, subject to change if cases are too high, risking the hospital system, and with some states potentially lagging and holding out for higher vaccination rates; and reopening with high case numbers may constrain confidence and hence the pace of recovery compared to last year. Pulling it all together, expectations for September quarter gross domestic product (GDP) remain around 4% down; expect a bounce in the December quarter, but only of around 1.5% or so, which will leave GDP through this year at around flat, but then we see a far stronger rebound of 6.5% or more through next year as confidence builds.
- The Reserve Bank of Australia (RBA) retains the taper – but hedges its upbeat outlook by extending bond buying to February. Contrary to expectations, the RBA proceeded with its July decision to slow its bond buying from $5bn a week to $4bn on the grounds the lockdowns will delay but not derail the recovery and that it will be back to around its pre-Delta path in the second half of next year. To cover the risk that it may be too optimistic, and provide a bit more monetary policy certainty, the RBA has extended its bond purchases at the $4bn a week rate out to mid-February, whereas prior to the Delta lockdowns some form of further slowing was likely beyond November. The RBA clearly has a high hurdle to reversing its taper, with the focus now more firmly on fiscal policy. Short of a major further change in the economic outlook, we are unlikely to see any significant policy changes from the RBA out to February, with the focus now more firmly on fiscal policy to help with the recovery.
|

 Source: ourworldindata.org, AMP Capital