Disclaimer
Information provided on this website is general in nature and does not constitute financial advice. Every effort has been made to ensure that the information provided is accurate. Individuals must not rely on this information to make a financial or investment decision. Before making any decision, we recommend you consult a financial adviser to take into account your particular investment objectives, financial situation and individual needs.
Weekly Market Update – 1st September 2017

Investment markets and key developments over the past week
- Share markets were impacted earlier in the week by the latest North Korean provocation but bounced back helped by continuing good economic data. US shares rose 1.4% over the week, Eurozone shares gained 0.2%, Japanese shares rose 1.2% and Chinese shares rose 0.4% but Australian shares lost 0.3%. Bond yields were largely flat. While oil prices fell slightly metals and iron ore rose. The A$ drifted up slightly.
- While the noise continues around global investment markets with Trump, North Korea, Hurricane Harvey, etc – global economic indicators continue to point to solid and improving global growth and rising profits but constrained inflation which will keep central banks supportive. All of which tells us we are still in the “sweet spot” in the economic cycle, an environment that remains positive for growth assets despite the risk of occasional corrections. Although the August payroll report in the US was a bit on the soft side with payrolls up a less than expected 156,000 and unemployment up slightly to 4.4%, trend jobs growth remains robust and a very strong reading for the August ISM manufacturing conditions index of 58.8 (including for employment plans) tells us that the US economy and underlying jobs market remains strong.
- Hurricane Harvey to depress US economic data (starting with jobless claims in the week ahead) and boost inflation but the impact will be temporary and the Fed will largely ignore it. Texas is the second largest economy and Houston is the fourth most populous city (with 7 million people) in the US so disruption caused by Harvey will depress US economic data for the next month or so, starting with a likely surge in jobless claims. Higher petrol prices from the shutdown of 20% of US refinery capacity will also boost headline inflation. However, as we have seen with past such disasters including Hurricane Katrina in August 2005 the negative economic impact will be relatively minor and temporary (US growth went from 3% in the third quarter of 2005 to 2% in the fourth quarter to 5% in the first quarter of 2006) and will be followed by a boost due to rebuilding. The Fed will look through it.
- The key implication of Hurricane Harvey for global investors though is that there is now less chance of a US shutdown/debt ceiling crisis. US Federal Government agencies like the Federal Emergency Management Agency will be central to the assistance and rebuilding effort and Texas voted for Trump. Given this, it’s inconceivable that Trump and Congress will countenance a Government shutdown and debt ceiling crisis in the immediate aftermath of a disaster. So maybe a bit of noise in late September or early October, but expect the shutdown risk at just 5-10% and debt ceiling risk at less than 5%. In fact, to speed an increase in the debt ceiling President Trump is reportedly considering tying it to a request for Hurricane Harvey relief funding and has already backed away from tying a shutdown to Mexican wall funding. More broadly at the margin Harvey may help galvanise Republicans in Congress to get moving on their agenda – with tax reform high on the list and infrastructure in there as well.
- After a two week lull North Korean risks escalated again early in the past week with North Korea flying a missile over Japan. While not new (it happened in 1998 and 2009), and timed to coincide with joint US/South Korean military exercises current underway, it has clearly ramped up the provocations and has seen a re-escalation of the war of words with the US, talk of more sanctions and renewed fears of a skirmish or war driving volatility in share markets and demand for safe havens like bonds and gold. Views remain that the risk of a skirmish or war has grown particularly due to a miscalculation by either side in the conflict, but that a diplomatic solution remains most likely as North Korea is not quite so stupid to want to set a war off knowing its regime would be wiped out and the US and its allies are aware of the potential huge loss of life in South Korea and potentially Japan that would flow from a military response. But we are a long way from a diplomatic solution yet and both sides obviously want to keep the threat level up in order to achieve a successful outcome from their own perspective. So the issue is likely to escalate further posing the risks of triggering further downside in share markets and demand for safe havens.
Major global economic events and implications
- US economic data remains strong. June quarter GDP growth was revised up to 3% annualised (from 2.6%) thanks to stronger business investment and consumer spending, the August manufacturing conditions ISM rose to a very strong reading of 58.8, consumer confidence rose in August to around its highest since 2000 (despite all the Trump-related political noise), consumer spending rose solidly in July and home prices are continuing to rise. While payrolls growth was less than expected in August this looks like noise with most other jobs indicators, including jobless claims and employment plans in the ISM survey, all very strong. All of this will keep the Fed on a tightening path, but continuing low inflation at just 1.4% on a core basis in July and wages growth of just 2.5% will keep it gradual.
- Eurozone economic data is also strong with confidence rising in August to levels last seen before the GFC driven by both consumer and business confidence. It’s even up and solid in Italy! However, unemployment remains very high at 9.1% in July and core inflation remained well below the 2% “target” at 1.2% in August. All of which will keep the ECB “patient”.
- Japanese jobs data remained strong in July with the ratio of job vacancies to applicants at its highest since 1974 (helped by Japan’s falling workforce) but household consumption data was weak. Industrial production fell in July but after a strong June and annual growth remains around 5%.
- Chinese business conditions were mixed in August – up for manufacturers, down a bit for services – and profit growth slowed a bit in July all consistent with some slowing in Chinese growth in the current quarter, but not much.
- As always – it’s not all good news globally. The Indian economy has slowed (to 5.7% year-on-year in the June quarter) with the July GST start up also impacting. That said a rebound in its manufacturing Conditions PMI in August is a positive sign that GST disruption is short lived.
Australian economic events and implications
- At last, some good news on the non-mining investment front. Australian data over the last week was mixed. Credit growth remains moderate with credit to housing investors showing a continuing slowdown to well below APRA’s 10% speed limit, residential construction didn’t bounce as expected in the June quarter and with building approvals and new home sales well down on peak levels the contribution to growth from dwelling investment looks to have ended. But against this business conditions PMIs are strong and business investment looks to have increased modestly in the June quarter (albeit not as much as construction data would suggest owing to a distortion from the largely imported Prelude LNG platform) and most importantly the outlook for non-mining investment is looking better.
- Capex plans for the current financial year point to a further slight fall in investment of around 3-4% (see the next chart). But while mining investment is still falling sharply (likely to be down around 22%), as a share of GDP its already collapsed to 2% from a high around 6-7% so its drag on growth is diminishing and it looks to be close to the bottom. More importantly, non-mining investment plans point to a rise of around 8%, but which could be even stronger if sectors such as agriculture, healthcare and education (which are not included in the capex survey) are allowed for. The point is that just as housing’s contribution to growth starts slow and reverse it will be offset by a diminishing drag from mining investment and stronger non-mining investment. This in turn should help growth lift a bit from the dismal pace of the last year.
- Home prices slow. Core Logic data for August showed that while the Melbourne property market remains strong, Sydney has cooled, price growth remains moderate in Adelaide and Brisbane, prices are still falling in Perth and Darwin but Hobart is now a star performer as the boom in Melbourne has forced buyers to look elsewhere. View remain that Sydney and Melbourne will slow, Perth and Darwin are close to bottoming and price growth will improve a bit in other cities.
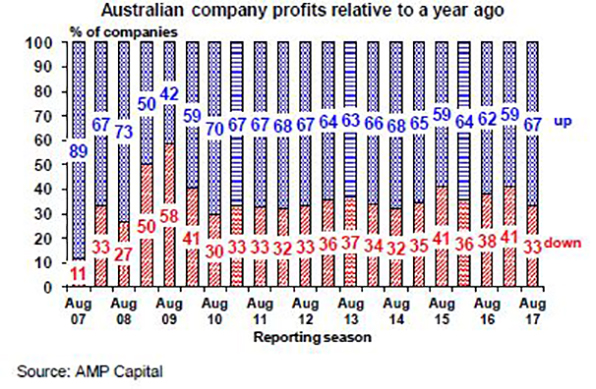
- The June half earnings reporting season in Australia is now done. The good news is that profits and dividends are up with 67% of companies reporting higher profits than a year ago (see the first chart below) and 64% increasing dividends from a year ago which is a good sign regarding the quality of earnings. Overall, earnings per share growth for 2016-17 looks to have come in around 17.7% which is a huge improvement after two years of declines. However, looking beneath the surface it’s not quite so good. First, the huge upswing in earnings owes to a 124% rise in resource sector profits and there is no doubt that the turnaround here is impressive and reflecting this they have increased their dividends substantially. However, profit growth in the rest of the market is more modest at around 6%. What’s more, only 39% of companies have surprised on the upside (which is less than normal and the weakest since 2013) and 31% have surprised on the downside. Outlook guidance has also been a bit soft. All of which partly explains why the share market fell fractionally in August. 55% of companies saw their share price outperform the market the day they reported but beneath the surface there has been intense volatility with some very sharp declines in share prices for companies who disappointed (eg Domino’s, Telstra, Suncorp, QBE, Bluescope, Healthscope, Harvey Norman) either in terms of the result, outlook comments or dividends. The problem of course is that PEs are relatively high and so much had already been factored in. As a result, expectations for earnings growth for the current financial year have been revised down a bit to 2.3%, although again it’s worth noting that profit growth for the market excluding resources is expected to remain relatively stable at around 4.3%. Key themes have been: large caps doing better than small caps; resources stocks back to strength; constrained revenue growth with the domestic economy just okay with housing still strong but retailing mixed; some disappointment from foreign earners; dividends (ex Telstra) continuing to roar ahead; and indications of stronger business investment.
- While underlying profit growth for Australian listed companies (ie, excluding the volatility in resources earnings) at around 6% is all right it’s well below that in the US (at around 11%) and Europe and Japan (at around 30% lately) so it’s another reason to maintain a bias towards global shares over Australian shares.

What to watch over the next week?
- In the US, expect the ISM non-manufacturing conditions index for August to remain solid and the July trade balance to worsen a bit (both Wednesday). Initial jobless claims (Thursday) will likely show a sharp rise due to Hurricane Harvey. The Fed’s Beige Book of anecdotal evidence (Wednesday) will also be released.
- The ECB on Thursday is very unlikely to make any immediate changes to monetary policy and is likely to stress that monetary policy should remain accommodative. While it’s edging closer to announcing a reduction in its quantitative easing program for 2018 from 60bn a month to maybe 35bn a month its unlikely to do it just yet as it remains in “patient” mode given low inflation and for fear of adding to Euro upside. In fact, the ECB may not provide a detailed announcement of its plans until December. Some sort of reduction for 2018 has been talked about for so long though that when it is announced it should not come as a surprise to anyone.
- Chinese trade data for August (Friday) is expected to show import growth slowing to around 10% year on year and export growth slowing to around 6% year on year.
- In Australia the RBA is expected to leave interest rates on hold for the 13th month in a row.Basically the RBA and rates are stuck between a rock and a hard place. Strong business confidence and jobs growth, the RBA’s expectations for a growth pick up and worries about reigniting the Sydney and Melbourne property markets argue against a rate cut. But record low wages growth, low underlying inflation, the impending slowdown in housing construction, risks around the consumer and the rise in the A$ argue against a rate hike. So it makes sense to leave rates on hold at 1.5% and this is likely to remain the case out to late next year at least. Speeches by RBA Governor Lowe on Tuesday and Friday will also be watched for any clues on the rate outlook.
- On the data front in Australia, most interest is likely to be on June quarter GDP data to be released Wednesday. Expectations are for 0.5% quarter on quarter with strong retail sales driving a boost to consumer spending and a slight rise in business investment but a flat contribution from net exports. This will see annual growth slip to 1.5%. June quarter data on wages, company profits and inventories on Monday and for net exports which are expected to be flat and public demand on Tuesday will help firm up GDP estimates. Expect July data to show a 0.2% gain in retail sales (Thursday) and a slight rise in housing finance (Friday).
Outlook for markets
- Share markets remain at risk of a further consolidation/short term correction. Although the risk of a US Government shutdown and debt ceiling crisis have receded a bit, US politics generally, North Korea and central banks remain potential triggers as we remain in a seasonally weak part of the year. However, with valuations remaining okay particularly outside of the US, global monetary conditions remaining easy and profits improving on the back of stronger global growth, a pullback could be seen as just a correction with the broad rising trend in share markets likely to resumethrough the December quarter and into 2018.
- Low yields point to ongoing low returns from bonds.
- Unlisted commercial property and infrastructure are likely to continue benefitting from the ongoing search for yield, but this will wane eventually as bond yields trend higher.
- National residential property price gains are expected to slow, as the heat comes out of Sydney and Melbourne.
- Cash and bank deposits are likely to continue to provide poor returns, with term deposit rates running around 2.5%.
- While further short term upside in the A$ is possible, view remain that the downtrend from 2011 will ultimately resume as the interest rate differential in favour of Australia is likely to continue to narrow as the Fed hikes rates and the RBA holds.
Source: AMP CAPITAL ‘Weekly Market Update’
AMP Capital Investors Limited and AMP Capital Funds Management Limited Disclaimer